In my previous articles, I have written about online sensors and the fact that some see these as not being accurate nor matching the standards applied in laboratory testing of used oil samples. To counter this, I have stated that the reproducibility and repeatability of the measuring technology are more important than the accuracy itself.
Allow me the indulgence to talk about my interest in classic cars.
My current project, a modified MGB GT, uses traditional analog gauges to monitor the coolant and oil temperatures and pressure. I did not calibrate the gauges, but I know from many miles at the wheel precisely where these normally sit.
Unlike modern cars that either forego the instrumentation or fix the needle firmly in one spot, typically between 85°C and 105°C, I can see small changes in the needle position.
This allows me to watch any early oil or coolant temperature movements. I can quickly establish if this is a concern based on the ambient temperature level of traffic or if it results from working the engine harder on a hill.
So, what has this to do with particle counting? Like any aspect of condition monitoring, it is not about any absolute alarm value but more about watching the shifts in the trends. But for trends to be meaningful, consistency is the key. Consistency in all aspects of the process. From sampling to sample preparation to actual measurement.
Therein lies a problem with particle counting. Years of experience in collecting samples for developing particle monitors and as a technical support engineer for particle trending and counting instruments highlighted how variable the process can be and how much care and attention to detail is required.
To throw another spanner in the works, comparisons between bottle sampling, portable instruments, and inline sensors are impossible.
Let’s start by looking at bottle sampling.
Bottle cleanliness is an issue. Background contamination will vary. While laboratories should provide a reference as to whether they are supplying Clean, Super Clean, or Ultra Clean (Figure 1.), this can vary within each rated level.
Add in the exposure during sampling, where the sealed bag method of sampling is not followed, and with varying weather conditions; it is not surprising that there can be an erroneous result.
I have witnessed a large variety of poor sampling undertaken by untrained staff, from either sampling straight from the drain port to undoing a pipe joint and flooding the bottle.
It is not just end-users that are guilty. On one occasion, a laboratory I visited had bottles in a storeroom in one box with lids in another, collected by technicians who would stuff them in their overall pockets to then use for sampling at the mine site.
In another case, the sample bottles did not fit the particle counter, so the laboratory had a box of bottles with no caps on the bench near the particle counter, into which a small volume of the sample would be decanted.
In addition to the bottle type, plastic versus glass, the volume will also play a role.
The larger the sample volume, the more representative the result will be (Figure 2.). While collecting samples in the past for research purposes in filtration, I often found that a 1L glass bottle contained only a fraction more particles than a 100mL glass bottle, and not the tenfold one might expect. Indeed, the volume of fluid flushed through the fitting before collection will have an influence.
This is why, in education, so much emphasis is placed on correct sampling practices to eliminate error and ensure consistency.
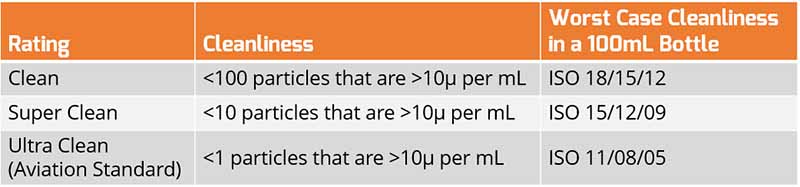
Figure 1. Bottle Cleanliness Ratings and The Potential for High Results Where Unmet Standards Exist
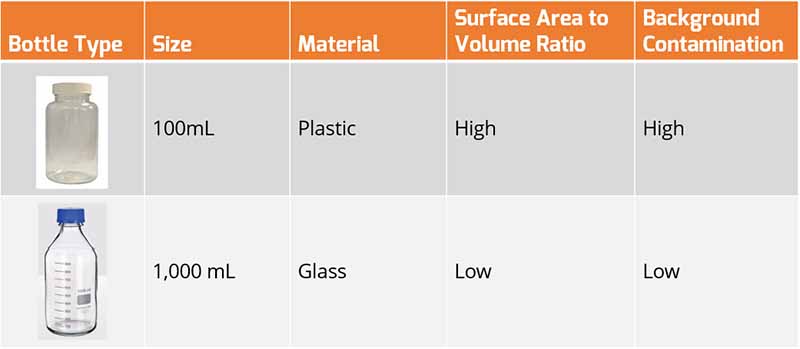
Figure 2. Bottle Size and Influence On The Background Count
Continuing with the bottle sampling process, sample preparation and processing is critical.
As with the wear debris analysis, particle counting should be one of the first tests to avoid altering the concentration thanks to settled particulate at the bottom of the bottle. Therefore, the sample must have all particles and debris evenly dispersed throughout the bottle to avoid varying concentrations. The first step is, of course, to shake the bottle vigorously.
Assuming that ullage or an air space is available, that is. A 100% filled bottle will not allow proper re-suspension, and decanting off some fluid before shaking will increase the concentration of the solids in the remaining fluid.
Vigorous shaking in a commercial laboratory requires the appropriate apparatus, preferably a three-axis shaker, which I know some laboratories use, and the time on the shaker will need to increase with increased viscosity of the oils being tested.
Similarly, the lower the oil’s viscosity, the faster the testing must be done following shaking to avoid re-settling. However, some laboratories use a roller rather than a shaker to minimize the generation of air bubbles that might affect the particle counter.
Air bubbles can be counted as solids owing to the diffraction of the laser light beam, though newer models can detect this to some degree, as with water droplets. Where a shaker has been used, and air has been generated, the sample is sometimes processed in an ultra-sonic bath and then put under a vacuum to remove the air.
All of this handling adds time and the potential for erroneous results.
At this stage, the particle counter will see what it sees and provide a count. Accuracy will be without question, assuming that the unit is regularly calibrated and serviced, and the number of particles is insufficient to cause blinding or other errors such as shadowing where one particle hides behind another, or two are seen as one larger particle.
But it begs the question: how meaningful is the result? If consistency has been maintained, then the result should be within a reasonable scope of accuracy, and over time, there can be a high degree of confidence in any changes in the trend.
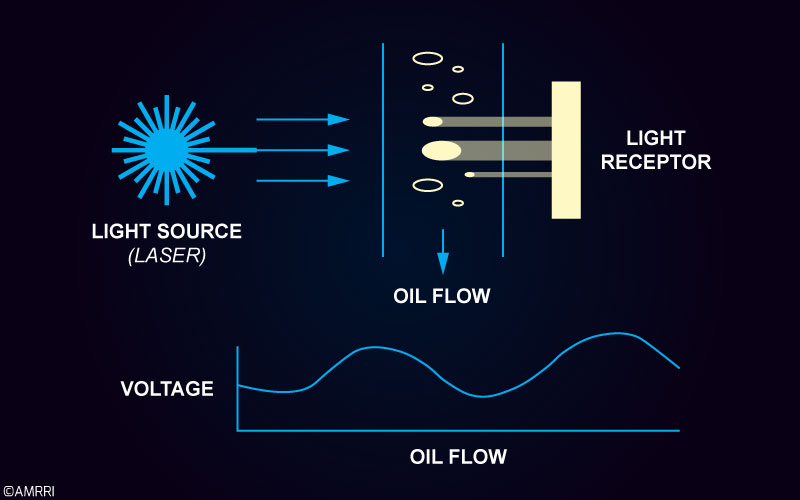
Figure 3. Light Extinction Principle for Particle Counting – APC ISO 11500
However, the problem arises when comparing the results of a laboratory from a bottle sample and a portable instrument or an online sensor.
Over the years, I have had many experiences with light extinction (Figure 3.) and filter blockage (Figure 4.) based portable instruments. This has involved the support and ongoing development of these by taking samples and using the microscope method of particle counting to evaluate the results from the instruments.
In both cases, it was possible to set up the instrument for the flushing volume before a count and the sample volume to be counted. In addition, the portable instruments could be left plumbed into the asset for any time.
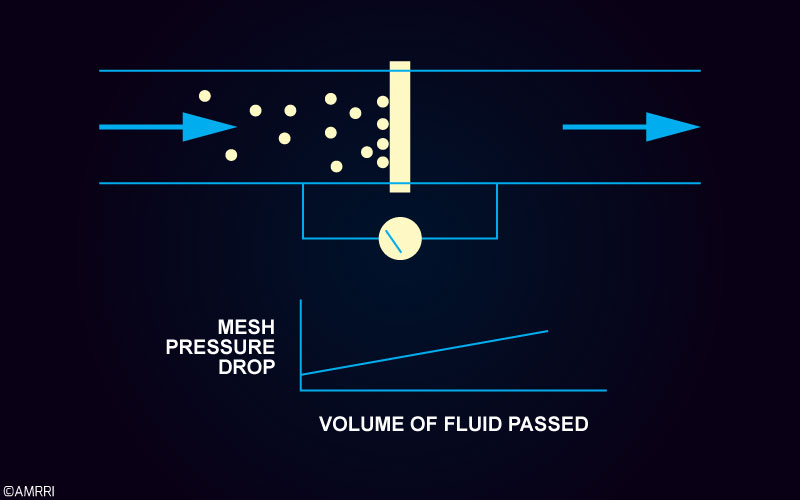
Figure 4. Filter Blockage Technique for Particle Trending
The greater the flush volume before counting, the cleaner the result.
Again, the greater the volume of oil sampled, the cleaner the result. The longer the instrument was left to its own devices, the cleaner the results were. How does an ISO 4406 result of 5/3/0 sound? I saw that on several occasions on turbines and fluid power systems after allowing the portable instrument to sample over three hours continually.
Amongst my colleagues in the technical support group, the record for a bottle sample was an ISO 4407 11/8 (via microscope). However, seeing much cleaner results with a portable instrument wasn’t uncommon.
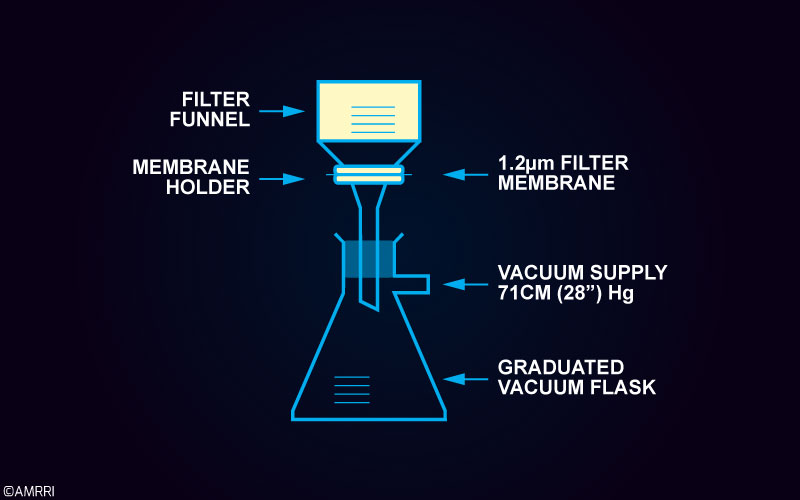
Figure 5. Particle Counting Via a Microscope – ISO 4407
The stakes are different here regarding attaining the sample. In most cases, the instrument is more likely to be connected to a turbulent flow than the traditional, or more typical, bottle sampling via a vacuum pump from tanks and reservoirs.
In addition, the far greater volumes of fluid being used for flushing and counting will have a significant impact even when the sample is collected into a bottle in a live zone without a vacuum pump.
Perhaps unsurprisingly, many end-users complained that the instrument I supported was inaccurate as the laboratory gave a far dirtier result from their comparison bottle sample.
The upshot is that, again, it is the trend in which we are interested, and the consistency of that process is again essential. Online sensors eliminate human error in consistency, while portable instruments do not eliminate the potential for error but significantly reduce that.
Therefore, whether bottle sampling or using an online tool, the trends remain the first focus in monitoring cleanliness, while the alert levels need to be set according to the method used and not at the same level.
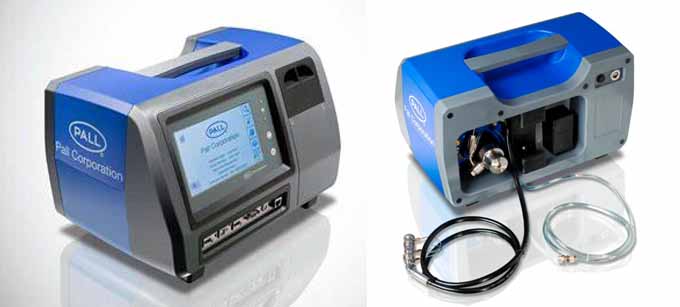
Figure 6. The Pall PCM500 Cleanliness Monitor utilizing the Filter blockage technology. Note the original Units were the PCM100, followed by a re-design to the PCM400 and then the current model shown here.
The instrument’s accuracy is, therefore, not as critical as the repeatability and reproducibility of the counting technique are ensured. That, of course, comes down to ensuring the instrument is regularly serviced and calibrated.
Is there ever a time when accuracy is essential? Certainly, apart from the case of research and development, there is a vital aspect of compliance. Compliance with standards on cleanliness certification, be that fuels or oils.
There are several standards related to roll-off cleanliness in terms of components manufacturing and assembly of assets such as turbines and fluid power systems. For this, accuracy, along with compliance, is critical.
To comply, one needs to utilize either the manual method of microscope counting (ISO 4407) or an automatic particle counter (APC) using light extinction (ISO 11500). The standards do not recognize filter blockage (although it is part of ISO 21018-3:2023).
Technically, it should be called a particle trender rather than a particle counter as it is a semi-quantitative determination of the particulate contamination level. An APC counts the number of particles in size bands as one would manually via a microscope.
A filter blockage device does not count but instead estimates the number of particles based on either an increase in the pressure differential across the mesh at constant flow or the rate of the flow decay through the mesh with constant pressure.
For those unfamiliar with the filter blockage technique, the instrument from Pall uses two meshes, one to measure the particles greater than 5µm and one to measure particles greater than 15µm.
The advantage of this technique over an APC using light extinction is that a reliable result (in my experience) can be achieved irrespective of whether the fluid is dark, has high viscosity, contains large wear debris, or is aerated or saturated with emulsified water droplets.
In addition, for engine oils where the extensive amount of soot particulate (typically less than 2µm) would cause blinding of the light sensor, the mesh allows the soot particulate to pass right through.
When flushing a system or a component, turbulent flow is required, which means the flushing fluid is heavily aerated. This makes it challenging to use an APC online. Consequently, in my work with end-users in this field, the concern was always that they would have to take a bottle sample and send it away for analysis to monitor the progress of the clean-up.
By using a filter blockage instrument, the progress could be observed in real-time, and then, for compliance, a bottle sample could be collected and analyzed as per the standards. I was often involved in the set-up of the Pall PCM 100 Series units on flushing rigs for fluid power users as it was found that the unit gave a reliable result in terms of particle monitoring under the flushing conditions irrespective of the fluid type or the amount of turbulence or water in the fluid.
My experience in the ongoing development and the technical support of the filter blockage device was that it made an ideal tool for the condition monitoring practitioner.
As with any portable instrument to be used for particle counting, my view is that the unit should have a built-in pump and pressure-reducing valve, with accessory hoses, to enable it to be used on drums, tanks, or even on live, high-pressure circuits as found in the fluid power industry allowing pressures over 300bar. In addition, the filter blockage devices can be used with multi-phase fluids found as fire-resistant fluids in hydraulic systems.
I worked on several projects where the portable instrument proved its worth as a particle trender, allowing the monitoring of filter performance on diesel engines through to the monitoring of flushing fluids on production lines.
So, are we too hung up on accuracy? In condition monitoring, there are times I see practitioners discussing accuracy when consistency is what is needed. However, in terms of compliance where appropriate, accuracy is critical. I don’t like to hear that resellers of APCs claim that an ISO 9000 company must use an APC as per ISO 11500 to comply with condition monitoring rather than certification.