
A new or rebuilt gearbox sends back a high iron result. Often, someone labels it break-in wear and waits for the next sample. That habit can be costly.
In continuous-process plants, debris may keep circling through loaded contacts. On the other hand, an unneeded shutdown or oil change also has a cost. So the real question is not whether early wear happens.
It is what is making the particles, and whether they should stay in the system.
What the Study Looked At
Our reliability team studied routine oil analysis results from wheel loader differentials and final drives. All of them came from one original equipment manufacturer. The study covered 612 samples collected over two years.
We sorted the samples into 500-hour bands of component time. In addition, we kept only samples taken just before a scheduled oil change.
612
Oil samples studied over two years
3,000 h
Approximate length of the elevated-iron break-in period
250–500 h
Suggested window for a first drain and flush
A Clear Break-In Period
Iron ran well above normal for about the first 3,000 operating hours. After that, it dropped and settled at much lower levels.
This trend pointed to a clear break-in period. However, it did not prove that every early iron result came from harmless surface mating.
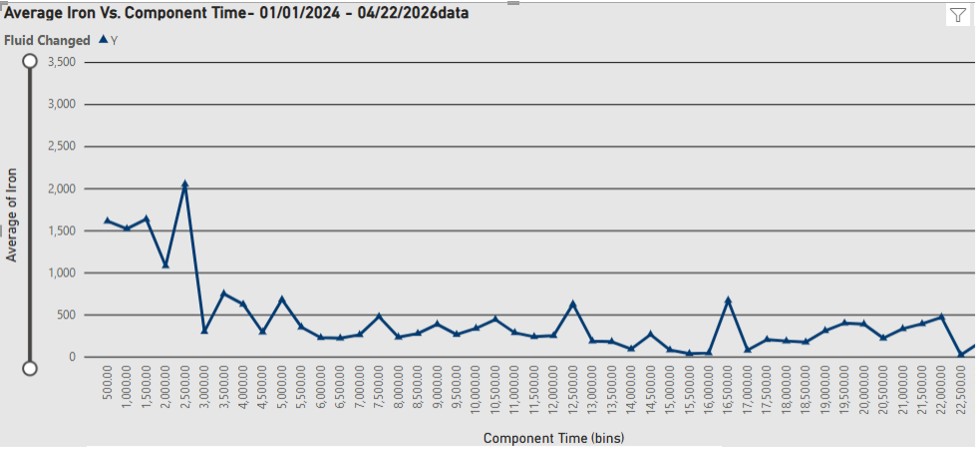
Figure 1: Average iron vs. component time across 612 samples from wheel loader differentials and final drives
What Routine Oil Analysis Cannot Explain
Elemental spectroscopy finds and measures iron in the oil. Yet it says little about particle size, shape or how the wear happened. For example, the same high result could come from three sources:
- polishing wear as gear surfaces form their contact patterns
- leftover debris from machining and assembly
- corrosive wear products
Each source calls for a different maintenance response.
Where Break-In Debris Comes From
Break-in wear generally comes from two places.
Debris Present Before Start-Up
Some debris is already there when a part enters service. This includes leftovers from machining, fabrication and assembly.
Debris Formed During Early Running
New debris forms as mating surfaces wear into each other and settle into a stable contact pattern. As the tiny high points, or asperities, wear away, fine metal particles enter the oil. In plain terms, the parts are settling into their working relationship, or finding their “happy place” within the component.
What the Ferrography Showed
Analytical ferrography, run to ASTM D7684, added the missing physical evidence. During the test, a magnetic field pulls ferrous particles onto a glass slide. Then an analyst checks them under a microscope for size, shape, amount and wear mode.
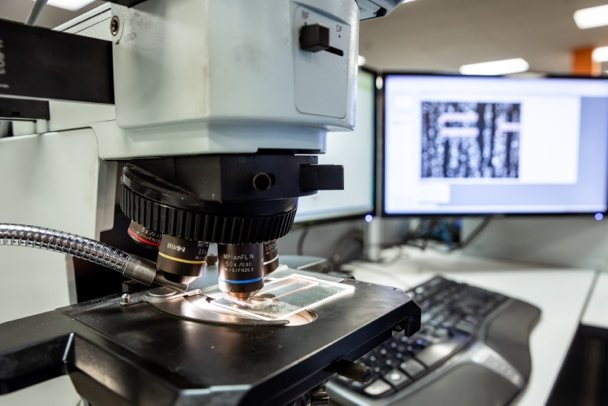
Figure 2: Analytical ferrography: an analyst examines ferrous particles on a glass slide under a microscope
The earliest samples held plenty of polishing wear. This fits new gear surfaces forming their working contact patterns.
They also held ferrous particles that looked like leftover machining and manufacturing debris. In other words, this debris was still in the components when they went into service.
How the Wear Signature Shifted
As running time went up, the amount of larger polishing debris fell sharply. By about 500 hours, the remaining signature had shifted mostly toward corrosive wear products.
These particles may react less to the ferrogram’s magnetic field. Still, they can add to the iron that elemental analysis measures.
This helps explain why iron concentration may remain elevated even while the population of larger metallic particles is falling.
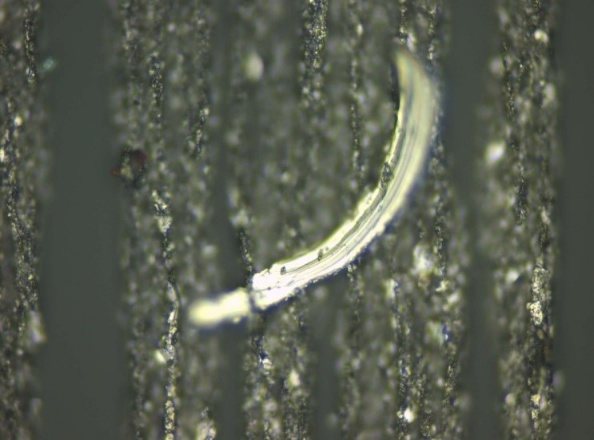
Figure 3: Cutting wear particle
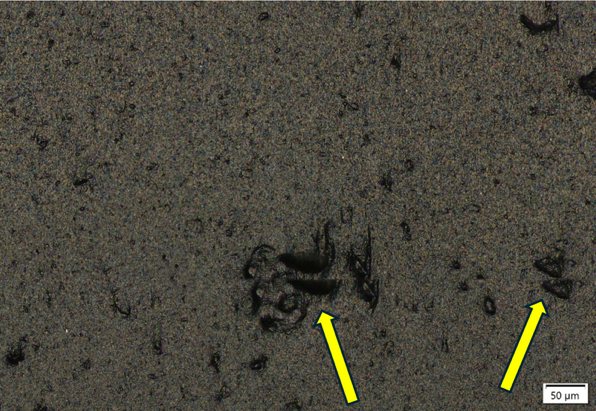
Figure 4: Corrosive wear particles
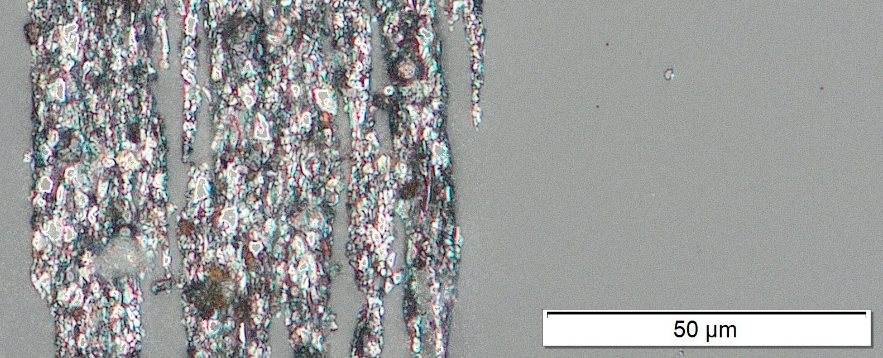
Figure 5: Rubbing and abrasive wear particles
Build Early Service into the Maintenance Plan
The study suggests four practical steps for maintenance and reliability teams.
Follow OEM Requirements First
Follow OEM maintenance and warranty rules before you change a commissioning or drain schedule.
Set an Early Baseline
Set an early oil analysis baseline for new and rebuilt parts. Then judge the trend, not a single iron result.
Characterize the Particles
Use particle characterization when high iron persists or the wear mechanism is unclear. Routine spectroscopy shows how much; ferrography helps explain where it came from.
Consider an Early Drain and Flush
For equipment like the differentials and final drives in this study, consider a first drain and a suitable flush at about 250 to 500 operating hours. Then check that interval against how severe the application is and your site practices.
Apply the Framework, Not the Numbers
Don’t copy this study’s numbers straight onto every reducer, gearbox or enclosed drive. Design, manufacturing tolerances, load, environment and lubricant all shape the break-in signature.
However, the decision framework works across many industries. These include pulp and paper, petrochemical, primary metals, and food and beverage plants. In each case, high early wear metals deserve interpretation, not an automatic pass.
Break-in wear is real, but it is not always benign.
When a team combines trend data with particle evidence, it can remove harmful debris sooner. It can also avoid needless work and set solid limits for future samples.
Related Reading
- From Lubrication to Insulation: Expanding Oil Analysis Beyond Rotating Equipment
- Case Study: Gearbox Condition Monitoring with Wear Debris Analysis
- Maximize Oil Analysis with Onsite Tests and Optimized Sampling Intervals
- Finding the Why: How Oil Analysis Supports Root Cause Analysis
- Justifying Your Oil Analysis Program: A Financial Perspective