When I first started with condition monitoring in the early 1990s on an open cast iron ore mine, we were blessed to have a geology laboratory to utilize for used oil analysis. In addition, we had the support of a commercial laboratory to whom we could send samples to complement and cross-check our testing.
Much of the sampling was the fleet of over sixty-seven haul trucks, which made sense given the complexity of the testing for the diesel engine oils. In addition, our testing on-site proved invaluable when evaluating potential new lubricants and quality control checks on new oil deliveries.
In the 1990s in the UK, it was still common for power stations to have their own laboratories, often with the Rotating Pressure Vessel Oxidation Test (RPVOT, then known as RBOT) equipment; unsurprisingly, given the sheer volumes of lubricants in use for the turbines.
My first job in the UK in 1994 was as a technical support engineer for a portable particle trending device (the Pall PCM series) and later the Pall branded portable HIAC particle counters, which led to a new position supporting the Entek range of bench-mounted instruments that had been acquired as part of the acquisition of Diagnetics Inc.
This work also involved the development of online sensors, which I foresaw as the future of lubricant-focused reliability in the late 1990s. It was exciting to be at the forefront of developing technology and ideas in industries like power generation, mining, steel making, and even F1 motorsport, where portable tools and sensors were in demand.
New ideas and science combined to offer advances in instruments like the Laser Net Fines and the ability to progress techniques like Dielectric Spectroscopy and X-Ray Fluorescence Spectroscopy in a more cost-effective package.
Subsequently, I have often been involved with consulting in support of various types of oil analysis tools and instrumentation, as well as guiding reliability teams on the best approach to adopt in terms of oil analysis to suit their specific business needs.
What’s Your Oil Analysis Strategy?
It can be a minefield for a reliability engineer looking to develop a strategy for the company’s lubrication aspects of their condition monitoring. More to the point, what works for one industry or geographic location, does not necessarily work for another. Equipment type, the environment, geo-political issues, and financial justification will all present differing needs.
With so many companies now sub-contracting the condition monitoring, the sampling frequency and schedule are often the casualties of the price-focused contracts.
This approach ticks the box; oil analysis has been done, and that meets the Original Equipment Manufacturer (OEM) and insurance or legal compliance requirements, and lip service has been paid to reliability. Reports are seldom reviewed, and valuable, reliable information is lost.
As with any business running aspect, ownership must be internal, with the reliability team driving the process. As an employee of the company and effectively a shareholder or stakeholder in the organization’s success, reliability, and I include oil analysis as a tool to that end, cannot be sub-contracted.
Therefore, for any company looking to establish a meaningful oil analysis program in support of reliability, one of the earliest steps in setting this up is the sampling schedule necessary to determine the approach to oil analysis.
It is essential to understand what a reliability-driven oil analysis program can offer. The first thought for most is the predictive focus; when to change the oil and what is happening regarding the wear debris. The proactive aspects are often ignored or overlooked, that is, the root causes, whether the oil condition or the contamination levels.
Table 1. explains the role that oil analysis can play and the possibilities regarding the sampling schedules.
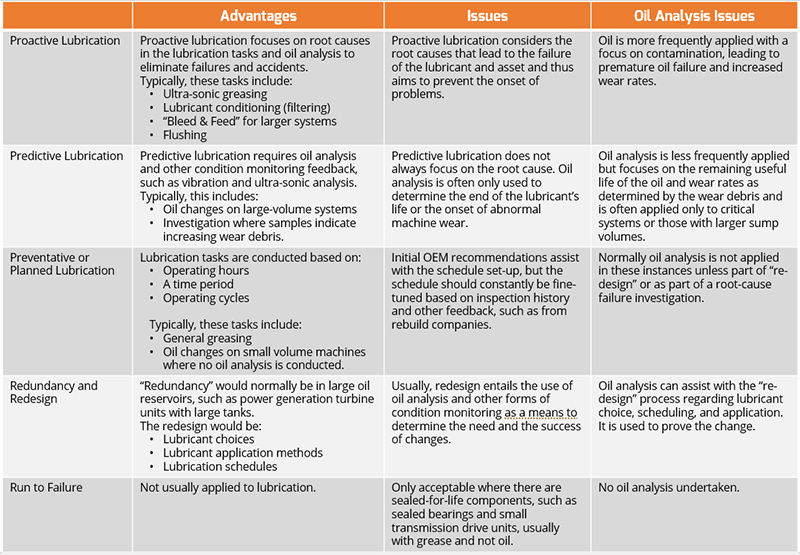
Table 1. Lubrication strategies and the role that oil analysis plays in supporting the activity.
This then sets the scene for oil analysis and, more so, the sampling schedule. It is immediately apparent that it is more than just a case of stating that we need to sample every three months, as I often hear.
There will be a mix of:
- Routine sampling at a determined frequency relevant to the machine type,
- Exception sampling for when any of the condition monitoring feedback highlights a situation moving to a predictive focus,
- Ad-hoc sampling for any situation where re-design requires information on which to make sound decisions.
Routine sampling at a fixed frequency is and must be subject to change based on several possibilities:
- Potential economic penalties for failure to deliver on time (client determined)
- Criticality reasons that may change (criticality – life, environment, and cost)
- Operational loading (production determined based on the level of business)
- Ambient conditions (seasonal or weather-based)
- Machine age (Reliability Bathtub Curve for mechanical systems)
- Lubricant age (particularly on large volume systems)
- Servicing (maintenance determined)
The establishment of a sampling schedule is, therefore, complex. However, to establish the routine sampling schedule, the list of assets to be sampled must first be determined.
This will include the following factors:
- Those assets already considered to be of the highest criticality,
- Assets with volumes of oil more than 25L or where the volume, and hence the cost of planned oil changes, exceeds the cost of sampling,
- Assets where other condition monitoring technologies are not possible,
- Assets that have a history of poor reliability.
Most OEMs, oil suppliers, and laboratories will advise a recommended sampling interval varying industrial machine types, either based on running hours or calendar months.
With some industries, sampling intervals based on running hours may lead to variations in the calendar intervals, but this is one of the reasons the laboratories like to have the running hours when a sample is submitted to normalize the data to produce more meaningful trends on the wear rates, as well as any information on oil changes and top-up oil volumes that also need to be considered in terms of the trend of the result.
Obviously, the more critical the industry, the tighter the sampling, as is the case for the aviation industry and similarly for the likes of the nuclear power industry or any other industry with high health, safety, and environmental criticality levels.
The recommendations from OEMs, oil suppliers, and laboratories are a useful starting point given that they have broad experience, either in the number of clients with similar units or from the supplier side with respect to Research and Development and ongoing monitoring. But these are generic and do not consider the individual needs of each asset. Therefore, several guides are available to adjust these intervals based on the factors mentioned above to ensure complete coverage.
However, the intervals are all based on the idea that there are typical failure patterns for each of these machine types. The rate at which these develop will determine the sampling interval to ensure that the indicators or early warning signs are noted before failure occurs. This is where the traditional P-F interval plays a role.
The P-F Interval is the interval between where the Problem is detected and the Failure occurs, typically based on a Failure Modes, Effects, Criticality Analysis (FMECA), and other asset history and experience. This predictive focus often determines the traditional oil analysis sampling intervals.
The more rapid the progress to failure from the first point of prediction, the more frequent the sampling must be performed. Usually, the worst-case scenario, such as water ingress, dictates this. Still, the sample undergoes the full range of laboratory testing, or a simple inspection for water is applied, and a longer interval is placed on the sampling.
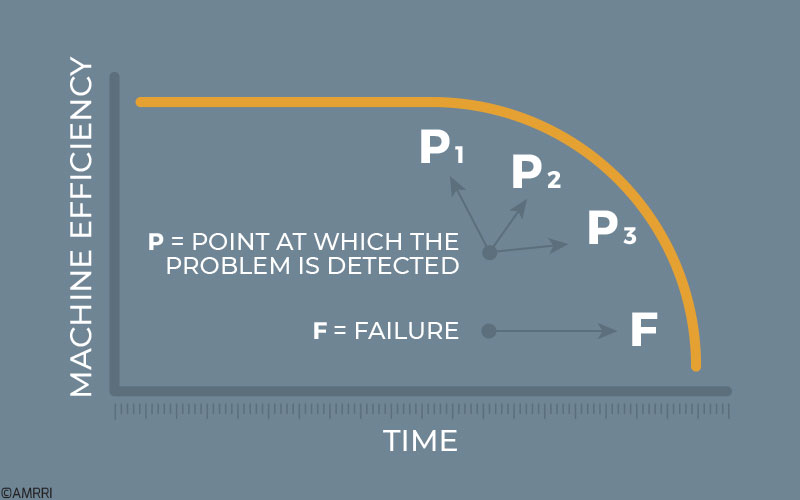
Figure 2. – The traditional P-F Interval for determining the best fit condition monitoring technology
Increasingly so, and rightly so, the P-F Interval is being shunned in favor of the D-I-P-F interval incorporating Design and Installation. However, ‘I’ should include Inspection, in my opinion.
The Design phase is where the oil analysis needs must be considered, whether using online sensors or fitting appropriate “Best Practice” oil sampling ports and other inspection aids. The Failure Modes, Effects, and Criticality Analysis (FMECA) at the design stage will determine these factors, whether an approach of routine analysis via an off-site laboratory or whether there is a need for online sensors, or a mix of more frequent inspection, possibly using a portable device.
The Installation phase, or the Inspection phase, is where the precision lubrication and maintenance occur. This entails more frequent sampling and inspection for early capture of root cause information, such as the onset of contamination issues. Early rectification of the root cause conditions helps to prevent the onset of abnormal wear and failure management.
How does any or all of this assist with the strategic approach to oil analysis?
The frequency of sampling will determine the cost of the analysis process.
The more frequently the sampling is required, the higher the cost through a commercial laboratory, where the price per sample will generally be the highest.
Consequently, to offset this, cheaper costs per sample are required. This means looking at simple on-site tests, portable instruments, or even permanently mounted sensors on the assets.
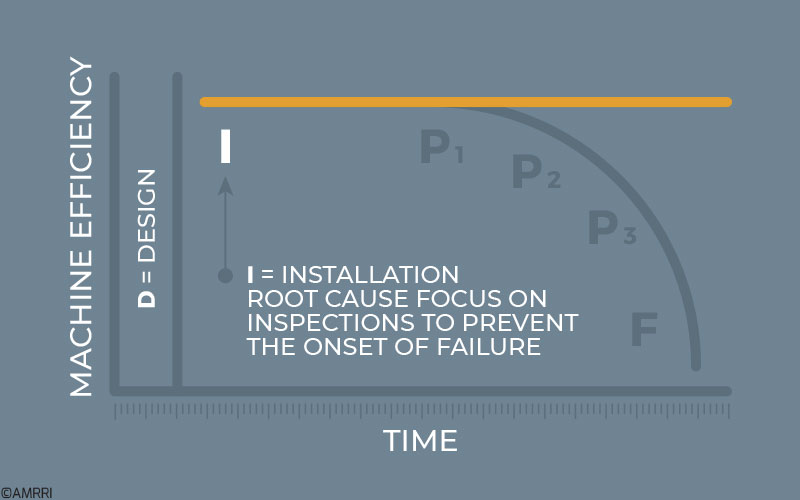
Figure 3. The D-I P-F Interval to ensure total reliability
A school of thought suggests that anything other than laboratory testing is inaccurate. It is a fair point, but we need more than accuracy. The repeatability and reproducibility of the test method are essential when evaluating oil analysis trends, irrespective of the accuracy.
In addition, owing to how often I have seen poor sampling performed, laboratory testing is far less representative of the actual condition within the machine. Consider particle counting, moisture testing, and wear debris testing, then several factors such as the sample location, sampling method, the sample container, and the tools used; the laboratory results usually create higher readings that are not representative.
This is based on my experience of supporting portable instruments and online sensors and comparing them to laboratory results. It does mean that two sets of limits need to be applied respectively where online testing is in place compared to bottle sample testing. However, I reiterate that the change in the trend is our first alarm condition.
Therefore, any method, no matter how crude, and so long as it is consistent in the testing methodology, is sufficient to provide alerts relating to change. In Table 5, I show my views on the approach to sampling where a mix of frequent yet low-cost sampling is balanced by less frequent use of laboratory sampling.
While using online sensors for the critical testing of individual parameters identified by an FMECA is increasingly popular, having a complementary laboratory testing program is still essential to cover all oil analysis objectives.
My experience working with reliability engineers is that oil analysis is often perceived as possible only via sophisticated test instrumentation in a dedicated oil analysis laboratory. What needs to be remembered or known is that the first recorded oil analysis test was allegedly conducted by Augustus H. Gill using a cup with a hole in the base and a stopwatch to determine the Kinematic Viscosity.
There is no reason end-users should not use this same set of tools even today. New technology has moved oil analysis forward. We can now choose a far wider variety of tools, sensors, and instruments at more affordable prices, meaning that the combined approach to oil analysis is ever more feasible and realistic.
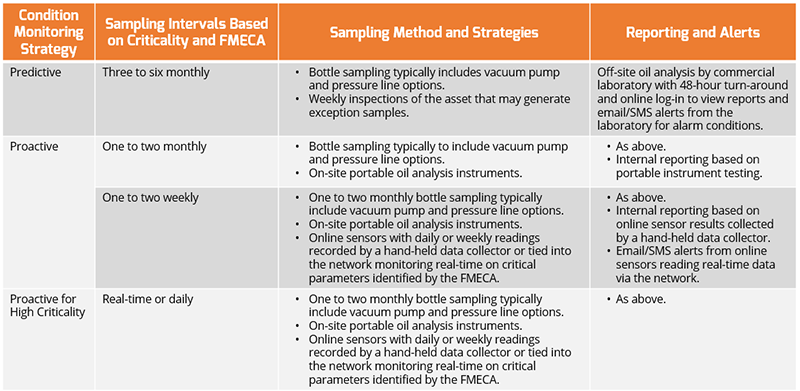
Table 4. The approach to Oil Analysis Strategy based on the Sampling Intervals.
The real benefit of on-site analysis, whether simple tools or online sensors, is that ownership is more likely to happen. However, there are several benefits to bringing some aspects of the oil analysis in-house:
- Usually, the more immediate response to alarm conditions and the opportunity to take a secondary, confirming sample to ensure the alert was not a false alarm.
- More frequent sampling thanks to the lower cost per sample and, therefore, better maintenance planning.
- Lubrication, mechanical, and condition monitoring technicians on-site have better interaction with each and with other personnel; in my experience, this is particularly important in dealing with internal politics.
- On-site will have more access to recent asset history and maintenance work and, more importantly, understand the machinery operation and environment better than any remote laboratory personnel.
- It complements an off-site oil analysis program providing a check and balance.
- Provides quality control checks on lubricant supplies and establishes baselines for on-site testing.
One such case study in which I applied this combined strategy with an off-shore Oil & Gas customer was in the North Sea on an oil rig. Clearly, the remote scenario and criticality of the production environment in terms of health, safety, and the environment demanded some on-site capability. In this instance, it led to two successes.
The first success was that the stand-by diesel engine units should be run for at least one hour during regular monthly testing. This ensures the oil warms up sufficiently to drive off any contamination, whether condensation or fuel dilution. However, as is often the case, the engines were only running up for ten minutes and then switched.
The lubrication technician would take a sample from the engine and then undertake a Flash Point test on the oil using the rig’s onboard laboratory instrument, which most oil rigs and FPSOs have. If the result was more than a 20°C drop from the new oil, words were then had with the operators to remind them to ensure the engines were run for the entire hour.
Unfortunately, some years later, the environmental officers now demand these engines be run only for ten minutes to minimize emissions. Still, with often-seen results of 10% fuel dilution in these instances, I am not sure I would want to rely on an engine in that state in an emergency.
The second success was that the rig had a portable particle trending device to check turbine oil supplies that arrived in bulk containers.
The results were significantly beyond the limit considered acceptable. Discussions with the supplier and myself initially focused on the sampling and measuring method. Still, an audit of the supplier’s facilities highlighted a fault in the handling and distribution of the turbine oil at the supplier.
Imagine the turbine’s cost going down, never mind the possible other consequences. The fact that the suppliers and other users in the industry had not noted this issue was equally as worrying in my mind.
In another case study of applying essential inspections and checks to the oil analysis process, the lubrication technician at a facility had fitted a permanent off-line filter circuit on a large, vertical shaft gearbox and would change the filter at six-month intervals.
The gearbox did not allow for other condition monitoring techniques because it rotated at only 14rpm and had yet to be set up for easier inspections planned into the rebuilds. Consequently, the old filter would be examined back at his lubricant store on changeout.
On one occasion, excessive wear debris was found trapped in the filter element, leading to the gearbox being replaced at a planned shutdown and preventing a potential $500,000 unplanned stoppage awaiting a replacement gearbox.
All plants potentially benefit from a combined approach to oil analysis. To make this as efficient as possible, the sampling intervals help guide the appropriate strategy to put in place for each of the assets based on the FMECA determinations. Remember that Root-Cause Analysis (RCA) should always be performed, and the lessons learned should be implemented into the strategic approach.