

Electric transport is changing how we design vehicles, transmissions and lubrication systems. The global electric vehicle market has grown steadily in recent years. In 2024, sales of electric cars topped 17 million units, about 25% more than in 2023. Then, in 2025, the market hit new highs again. Sales passed 20 million units, growing by around 20% year on year.
Current forecasts suggest this growth will continue over the next five years. For example, the International Energy Agency estimates that, under current policies, electric vehicles could make up more than 40% of global car sales by 2030.
17 million
Electric cars sold worldwide in 2024, up about 25% on 2023
40%+
Share of global car sales that could be electric by 2030 (IEA, current policies)
50 million
Potential EV oil samples per year by 2030 if 10% of the fleet is monitored
Growth Will Vary by Region
Growth will not be even across regions. China will continue to lead, with electric vehicles making up close to 80% of its car sales in 2030. In Europe, the share could approach 60%. The United States, by contrast, would grow more slowly, to around 20%. Some sources, however, expect a rebound in sales of gasoline passenger vehicles.
This growth will directly affect transmission lubricants. Electric vehicle gearboxes are often simpler than transmissions in combustion-engine vehicles. Even so, they run at very high speeds under heavy thermal, electrical and tribological stress.
Because of this, it will matter more and more to test the oxidative and thermal stability of these oils. We also need to know how well they protect gears, bearings, metal surfaces and electrical parts.
Simpler gearboxes do not mean easier conditions for the oil.
Working Conditions of Oils in Electric Vehicles
Transmission oils in electric vehicles work under different conditions than lubricants in conventional vehicles. In combustion engines, fuel, condensation water and soot can contaminate the oil. So can nitrogen and sulfur compounds and other combustion products.
In an electric drivetrain, these contaminants are often absent. As a result, some degradation mechanisms and failure modes become less common.
However, electric vehicles bring other demanding conditions:
- Operating temperatures that can exceed 120°C, especially when the electric motor and transmission are integrated.
- Speeds that can reach about 20,000 rpm.
- High lubricant shear rates in gears and bearings.
- A very thin lubricating film at the contacts, close to a mixed regime with a λ between 1 and 3.
- Possible electric fields and stray (parasitic) currents.
- Closer links between lubrication, cooling and electrical insulation.
- Risk of free radicals, oxidation and deposits.
How Oil Oxidizes
Oil oxidation happens through chain reactions in three stages.
Initiation
Heat, oxygen, light or mechanical action create free radicals.
Propagation
The radicals react with oxygen and form peroxides, aldehydes, ketones and carboxylic acids.
Termination
The oil forms polymers, resins, sludge and deposits.
What FTIR Shows
FTIR records the wavelengths that chemical bonds absorb. Degradation products often contain carbonyl groups (C=O), such as aldehydes, ketones and carboxylic acids. When these products appear, absorption in that part of the spectrum usually rises. In other words, higher absorbance means a stronger FTIR signal from these compounds.
Labs should measure the same way each time and compare against new oil or a baseline. That way, they can track the compounds that drive further oxidation of the oil.
| cm⁻¹ | Compound | Δ Last | Severity |
|---|---|---|---|
| 2720 | Aldehyde C-H overtone – Aliphatic aldehyde (oxidation product) | +7.992 | CRITICAL |
| 1780 | Lactone C=O stretch – Gamma-lactone (oxidation product / cyclic ester) | +5.805 | CRITICAL |
| 3600 | Free O-H stretch – Alcohol / Phenol (oxidation product) | +4.992 | CRITICAL |
| 1110 | C-O stretch – Primary alcohol / Phosphate P-O (oxidation/additive) | +4.620 | CRITICAL |
| 3500 | O-H stretch – Hydroperoxide / Alcohol hydrogen-bonded (early oxidation) | +3.973 | CRITICAL |
| 1750 | Esters / Lactones – C=O stretch (ester/lactone from oil oxidation) | +3.748 | CRITICAL |
| 1705 | Ketone / Acid C=O – Aliphatic ketone or carboxylic acid (oxidation) | +3.695 | CRITICAL |
Table 1: Oxidation results of electric vehicle oils. Source: J. Alarcon, degradation of electric vehicle oils, 2024
Base Oil and Additives
The stability of the lubricant depends on both the base oil and the additive package. Key additives include phenolic antioxidants and anti-wear and extreme pressure additives, such as zinc dithiophosphate-type compounds.
They also include viscosity modifiers and other parts of the package that control friction, corrosion and deposits.
Comparative Accelerated Degradation
For this analysis, we studied two oils. Oil A is a synthetic oil for gearboxes under high pressure and heavy load. Its maker highlights its stable viscosity over a wide temperature range. The maker also stresses how well it protects against wear and corrosion.
Oil B, by contrast, is a synthetic oil designed for transmissions with dry electric motors and for electric and hybrid vehicles. Its maker targets high-torque transmissions and better powertrain efficiency.
| Method | Main principle | Test conditions |
|---|---|---|
| ASTM D5704 | Test on a gear transmission | 162.8°C, air, copper plate, 50 h |
| ASTM D2272 | Rotating pressure vessel | 150°C, oxygen, copper catalyst and water |
Table 2: Accelerated degradation methods used in the study
ASTM D5704 includes the effect of gear-to-gear contact and oil shear. ASTM D2272, on the other hand, adds rotation, water and moving contact between oil and oxygen.
How We Measured Degradation
We measured degradation with the following analyses:
- Kinematic viscosity at 40°C and 100°C
- Total acid number (TAN)
- Pentane and toluene insolubles
- Chemical changes identified using FTIR
The results showed that the oils behave differently depending on the method. Also, the severity of the procedure clearly shapes the type and size of the degradation.
The test method decides what kind of degradation you see, and how much.
Oxidation Stability Results
In time-to-pressure-drop testing, Oil A showed higher thermo-oxidative stability than Oil B:
| Method | Oil A | Oil B |
|---|---|---|
| ASTM D2272 | 756 min | 423 min |
Table 3: RPVOT results for Oil A and Oil B
This gap confirms that Oil B oxidizes more easily under dynamic conditions. Those conditions include pressurized oxygen, water, a catalyst and rotary motion.
Viscosity Changes
In ASTM D5704, viscosity at 40°C rose by 28% in Oil A and 11% in Oil B. At the same time, viscosity at 100°C fell by 20% in Oil A and 7% in Oil B.
At first, this looks contradictory: viscosity rises at 40°C but falls at 100°C. In fact, several mechanisms working together explain it. Oxidation can favor products of higher molecular mass. Shear, however, can destroy viscosity modifiers and polymer structures. In addition, the radicals that tribological action creates can form partly polymerized or insoluble products.
A rise in viscosity may point to polymerization, insoluble products or changes in additives. A drop, on the other hand, may come from shear, broken viscosity modifiers or thermal degradation.
From an oil analysis point of view, these results show that viscosity alone does not always reveal the degradation mechanism.
Evolution of the Acid Number
Both oils showed a higher acid number after the tests. This parameter is a key sign that acidic oxidation products are forming. These include carboxylic acids and other oxygen-containing compounds.
In Oil A, the acid number rose by up to 100% (ASTM D2272). In Oil B, meanwhile, it rose by almost 200%.
FTIR Spectroscopy Results
The great strength of FTIR is that it shows changes in the chemical makeup of oils. As a result, it helps explain how the lubricant failed. Four regions of the spectrum tell the story.
1800–1640 cm⁻¹
Carbonyl groups and carboxylic structures form, linked to advanced oxidation.
1200–1000 cm⁻¹
C–O bonds form in alcohols, ethers and other early oxidation products.
1000–900 cm⁻¹ and 700–650 cm⁻¹
Extreme pressure and thiophosphate anti-wear additives break down.
3700–3600 cm⁻¹
Phenolic antioxidants are used up or break down.
In-Service Electric Car Transmission Oil Analysis
Laboratory results give us a reference for how oils behave. Still, we need to compare them with real samples from cars in service. That way, we can check the findings and explain many of the failure modes of electric car oils.
The main difference is that the in-service oil forms more carbonyls and carboxyls. This clearly shows much more advanced oxidation. In practice, operating conditions don’t just start oxidation. They also push it further, toward more oxidized end products.
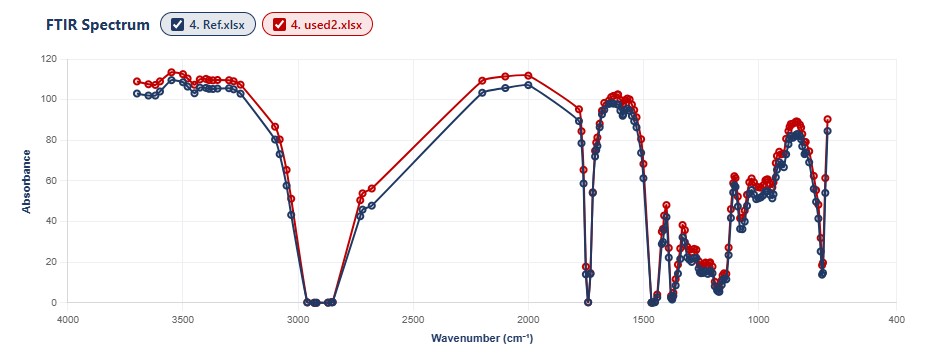
Figure 1: Comparative FTIR results of electric vehicle oils. Source: J. Alarcon, degradation of electric vehicle oils, 2024
Additive Breakdown in Service
We also saw greater breakdown of the extreme pressure additives, with clear changes in their structure. However, the phenolic antioxidants broke down less than in the laboratory tests.
| cm⁻¹ | Compound | Δ Last | Severity |
|---|---|---|---|
| 970 | Antiwear – P-O-C stretch (antiwear additive characteristic / ZDDP) | +5.520 | CRITICAL |
| 3650 | Phenolic region (antioxidant) – Free O-H phenolic antioxidant | +1.235 | STABLE |
Table 4: FTIR results for in-service electric vehicle transmission oil
Real-world operation pushes oxidation further than the laboratory tests did.
EV Evolution and the Commercial Market
The study shows that transmission oils for electric vehicles need their own test methods. It is not enough to reuse methods built for conventional turbine oils, greases and transmission fluids. After all, the failure modes are completely different.
Labs might miss changes until too late, and that leads to failures in the transmission system, the heart of the electric car.
The Business Case for EV Oil Analysis
Oil analysis for electric vehicles has an attractive commercial future. Compared with combustion engines, though, it will be a market with a higher value per sample and less frequent sampling. The global electric vehicle fleet could pass 240–250 million units by 2030.
At first, the main opportunity will not be in private vehicles. Instead, it will be in fleets, taxis, delivery, leasing, buses and machinery. In these uses, transmissions run at high speed and temperature, which justifies predictive maintenance programs.
A Market Worth Hundreds of Millions
Suppose 10% of the EV fleet joins monitoring programs, with one to two analyses per year. In that case, the global potential by 2030 could be around 50 million samples per year.
Basic packages cost about €35–70. Advanced analysis costs €80–150, and fault diagnostics or OEM projects cost more than €150. At those prices, the market could reach several hundred million euros per year worldwide.
The most profitable areas will be recurring fleet contracts and warranty diagnostics. Others include setting specific limits for EV fluids and building digital platforms. Such platforms bring viscosity, acid number, FTIR, metals and particles together.
From Emerging Application to Major Field
If global sales keep up this pace, electric drivetrains will no longer be an emerging application. Instead, they will become a major field for research in lubrication, condition monitoring and predictive maintenance.
As the global EV fleet grows, the need for standard methods and specific alarm limits for these fluids will grow too.
Related Reading
- From Watts to Wear: Understanding Coolant Degradation in Modern Data Centers
- From Lubrication to Insulation: Expanding Oil Analysis Beyond Rotating Equipment
- How to Interpret RPVOT Regions for Better Lubricant Decisions
- Lubricant Additive Depletion as an Early Asset Health Signal
- How to Interpret Industrial Oil Analysis Data Like A Pro