Many companies utilizing rotating equipment have initiated or planned to create decarbonization strategies. The process reduces and compensates for the emissions of carbon dioxide equivalent (CO2e), ultimately down to “Net 0”.
Lubricants are an essential component in rotating equipment, so it makes sense to determine optimum ways of managing these fluids in the most sustainable way possible, which includes enhancing their performance.
Life Cycle Assessment (LCA) is a methodology for assessing environmental impacts associated with all the stages of the life cycle of a product1 and is the accepted tool to analyze the potential environmental impacts of products.
It is, therefore, the optimum tool for measuring the sustainability of a lubrication program and comparing various products and strategies. Performing an LCA is defined in ISO 14040. It takes a thorough inventory of all the materials and energy required to make a product, calculating a cumulative potential environmental impact.
This calculation assesses midpoint indicators, such as stratospheric ozone depletion, acidification, eutrophication, water scarcity, and toxicity potential. Still, this article will focus on Global Warming Potential measured in CO2e.
LCA is a helpful tool for a variety of purposes. For example, how do you know if an electric vehicle will lower emissions more than an internal combustion vehicle? What if the electric vehicle gets its power from a coal-burning power plant?
Doesn’t mining lithium and manufacturing batteries produce a lot of emissions? This question has many complexities, and the answer would only be possible by performing a cradle-to-grave LCA. (Incidentally, there are many studies on this, and electric vehicles significantly reduce emissions over the vehicle’s life2.)
Cradle-to-Gate vs Cradle-to-Grave
When performing an LCA on a lubricant, one can look at various product life stages. Cradle-to-Gate represents the carbon impact of a product from its inception to the moment it is ready for sale. This is the most common LCA done on lubricants, as manufacturers do not have control over the use of the product once it is sold.
Cradle-to-Grave also covers the product’s use and how it is treated at the End of Life. Fig. 1 illustrates these stages and identifies the difference between “cradle-to-gate” and “cradle-to-grave.”
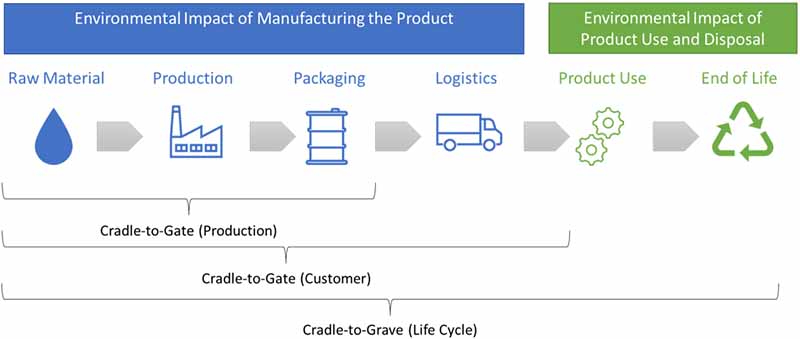
Figure 1: Stages of a lubricant’s life
The CO2e contribution of extracting, refining, and blending the crude oil (cradle-to-gate) makes up a smaller value of greenhouse gases compared to its End of Life (cradle-to-grave)3.
Although antioxidants have approximately twice the carbon footprint of mineral oil, they contribute a relatively small amount to the overall total since they are used at a small percentage in the formulation4.
Depending on what part of the world the used oil is generated, the contribution of CO2e at the End of Life is defined by what percentage is incinerated or re-refined. Different base oils may also contribute more CO2e to the overall product.
For example, Polyalphaolefins (PAOs) have about twice the cradle-to-gate CO2e footprint as mineral oils. However, the End-of-Life of both products is the same representing a more significant percentage.
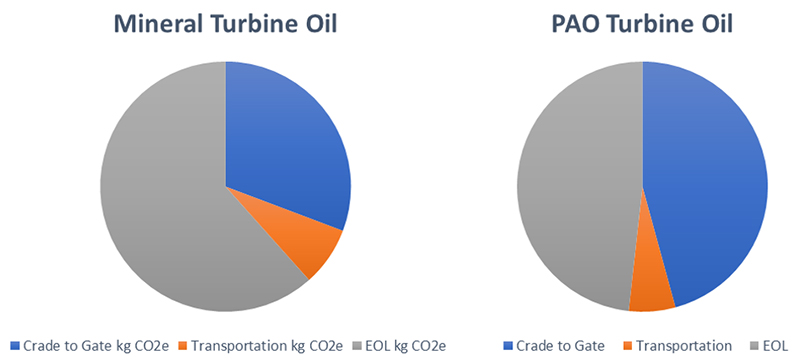
Figure 2: Cradle-to-gate CO2e comparison between mineral and PAO turbine oils.
The overall CO2e contribution of a mineral turbine oil versus a PAO turbine oil is illustrated in Figure 2. Therefore, an effort to extend the life of in-service oil will significantly impact lowering the total carbon footprint of a lubricant.
It is also interesting to note that transportation plays a minor role in the overall carbon footprint. This is the case as long as lubricants are not being flown around the world.
Comparing Lubricant Sustainability
Many factors go into measuring the sustainability of a lubricant. Figure 3 illustrates these various factors and pathways to make the lubricant more sustainable.
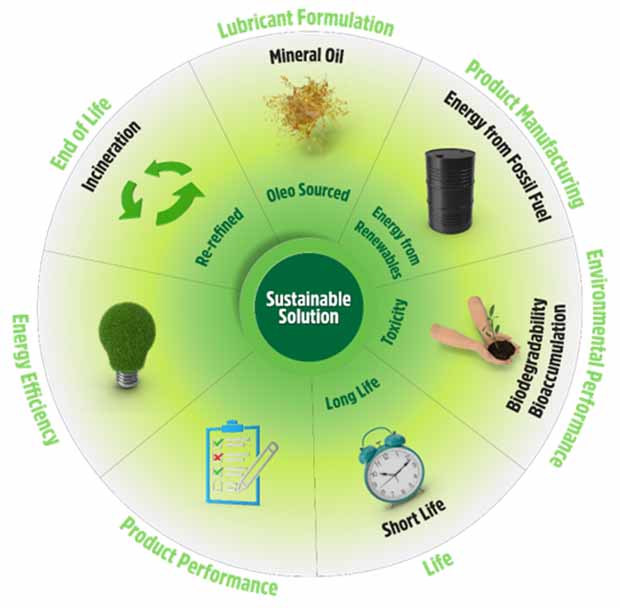
Figure 3: Factors influencing the sustainability of a lubricant.
Using a comparison like this, it is possible to compare the sustainability of various lubricants and lubrication practices. Remember that each category can be converted to kg CO2e, except for environmental performance, which is its own category.
Biodegradability performance, bioaccumulation results, and the oil’s toxicity rating are essential aspects of the sustainability of the oil. Still, those qualities must be directly compared since they are on different scales.
Based on this spectrum, the ultimate sustainable lubricant would be plant-based (oleo sourced) and made from renewable energy; one which is readily biodegradable, non-toxic, and doesn’t have bioaccumulation; one which provides a long service life and improves the energy efficiency of the system it is lubricating; and finally at the end of this ideal fluid’s life, it is re-refined or re-used in another application.
Also, for a sustainable lubricant to be practical, it needs to be fully compatible with the application, including materials of construction and contamination ingression. For example, an oleo-based ester may tick all the boxes but may shrink system seals and hydrolyze due to high water contamination, making it unsuitable for a specific application.
Lubricant Sustainability Case Studies
Following are three examples of comparing the sustainability of different lubricants by using LCA. The examples illustrate that the product with the highest cradle-to-gate carbon footprint is not necessarily the one with the lowest carbon footprint once a cradle-to-grave analysis is completed.
Example 1: Group II Engine Oil versus Longer-life PAO Engine Oil
Producing PAO-based engine oil is approximately 40% more carbon-intensive than Group II-based engine oil.
For this example, we’ll assume a typical engine oil formulation with the following ingredients5:
- 80% Base Oil
- 2% Detergents
- 6% Dispersants
- 9% Viscosity Modifiers
- 1% Antioxidants
- 2% Antiwear
The difference in these comparative formulations is using a PAO synthetic oil instead of mineral oil (80% of the formulation). Let’s assume both formulations produce the same mileage; the only difference is that synthetic oil will last twice as long. The LCA calculations are below in Figure 4.
Figure 4: Lubricant Sustainability Spectrum comparing CO2e of GII engine oil vs. PAO engine oil with 25% longer drain interval.
The LCA values for the Cradle-to-Gate4 and Gate-to-Grave6 are used from published LCA source material. The PAO-based engine oil is approximately 63% more carbon-intensive to produce than the Group II engine oil.
However, if one assumes that the PAO product will last twice as long, its total carbon footprint is 42% lower than the Group II formulation. This is a good example showing the importance of performing a cradle-to-grave LCA to differentiate between the sustainability of different products.
Example 2: Re-refined Hydraulic Oil Versus an Energy Efficient Hydraulic Oil
There have been a lot of studies on the use of energy-efficient hydraulic oils and their impact on power consumption7,8. For this example, we’ll compare a conventional hydraulic oil using a re-refined base stock to an energy-efficient formulation. The estimated cradle-to-gate carbon footprint for these two products is below:
- Re-refined hydraulic oil: 0.63 kg CO2e/kg9
- Group II, High VI, Energy Efficient hydraulic oil: 1.06 kg CO2e/kg5 (Assumes 8% viscosity index improver in addition to antioxidant and antiwear additives.)
At first glance, the energy-efficient hydraulic oil requires approximately 68% more carbon to produce. However, by using LCA, we can better evaluate the performance of the two products throughout their life cycle to provide a fairer comparison.
For this example, a Milicron® plastic injection molding machine (3,000 US tons; 230000; Performance Model) was used, containing 590 gals of hydraulic oil. To compare the energy efficiency of the two products, Mobil®‘s Industrial Hydraulic Oil Productivity Calculator was used.
View an example of this calculator in the State of Pennsylvania Energy Efficiency Technical Reference Manual, under the chapter “Energy Efficient Industrial Lubricants: Reducing Energy Consumption with Industrial Lubricants”10.
Assuming the Energy Efficient Hydraulic Oil decreases power consumption by 3%, below is an example of Mobil’s calculator determining power usage.
Figure 5: Mobil’s Hydraulic Oil Efficiency Calculator
The model calculates that an energy-efficient hydraulic oil formulation with a 3% efficiency improvement will reduce energy consumption by 29,125 kW-hr a year. We can then convert the kW to CO2e using EPA’s online calculator11.
Another benefit of upgrading to an energy-efficient formulation in this application is a minimum service life extension factor of 3X. These calculations can now be put into an LCA comparison, as seen in Figure 6.
Figure 6: Comparison between a re-refined and energy-efficient hydraulic oil. LCA demonstrates significant savings even though the energy-efficient formulation is more carbon-intensive to manufacture.
This calculation determined that the energy-efficient formulation reduced the overall carbon footprint by 4%. Although this doesn’t seem significant, this equates to almost 12,000 kgs per year of avoided CO2e emissions in one machine.
When one considers the thousands of plastic injection molding machines in use, the carbon footprint impact of using an energy-efficient hydraulic oil is significant.
This is a good example to illustrate that the performance improvements offered by new lubrication technologies may far outweigh their extra cradle-to-gate carbon footprint.
As can also be seen from the Mobil calculator, even though energy-efficient formulations are more expensive to purchase, they also provide a significant return on investment. LCA can be considered the sustainability version of Total Cost of Ownership.
Example 3: Avoiding a “Varnish Flush” in a 5,000 Gallon Gas Turbine
Maintaining a turbine oil with low varnish potential has many financial benefits for a power plant. In addition to increased availability and reliability, one may avoid doing a “varnish flush” between oil changes. Flushes are energy- and volume-intensive, accumulating a sizeable carbon footprint.
Fluitec invented a solubility-enhancing technology called DECON, which decontaminates lube oil systems between oil changes. Among other benefits, the technology allows rotating equipment users to avoid having to do a varnish flush between oil changes.
The following case examines the sustainability impact of adding 3% DECON to an in-service turbine oil to avoid having to perform an oil flush. In this example, we use a gas turbine oil with a 5,000-gallon reservoir and an eight-year life span.
The Fluitec Value Impact Calculator adds the cost and carbon footprint of adding DECON to the fluid and measures the value of not having to perform a flush during the following oil change. Review the results in Figure 7.
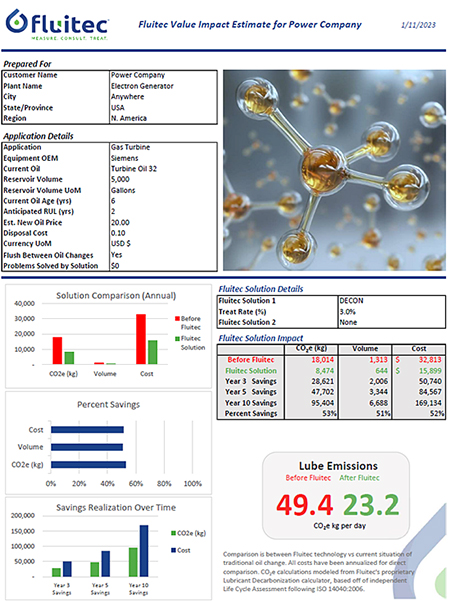
Figure 7: Example of the high carbon footprint involved in lube oil flushing and how maintaining a low varnish potential in your turbine oil reduces your carbon footprint.
By using DECON and avoiding having to perform a lube oil system flush, this turbine can avoid generating 18 metric tons of CO2e per year. A calculation like this would be challenging without performing a cradle-to-grave LCA.
Other Strategies to Manage Oils in a More Sustainable Way
Multiple other lubricant management strategies can lower the carbon footprint of your lubricant program, including:
- Selecting the best-performing oil for your application resulting in longer drain intervals and lower maintenance costs.
- Implementing an oil analysis program to optimize the drain intervals of your oils. Keep in mind that not acting when oil analysis warrants it increases maintenance costs and dramatically increases your carbon footprint.
- Avoiding Varnish. In addition to failed components, deposits can create an insulating layer on bearing surfaces, resulting in higher temperatures and lowering the system’s energy efficiency.
- Extending lubricant life by additive replenishment. When done responsibly, this practice can double the life of your in-service oil, significantly lowering your carbon footprint.
- Re-refining an oil at the end of its life. Creating a circular economy with your lubricant at the end of its life by re-refining instead of incinerating will reduce the carbon footprint of your lubricant program.
- Minimizing contamination ingression. Studies have shown that contamination is responsible for as much as 70% of premature machinery failures. Deploying a solid contamination control program saves significant operational costs and reduces the associated carbon footprint.
As the saying goes, “If it doesn’t get measured, it doesn’t get managed.” In the case of achieving sustainable lubrication, using cradle-to-grave LCA principles allows you to measure and improve the sustainability of your lubricant program.
This article illustrates how to perform these calculations, and as the case studies showed, the initial carbon footprint of the lubricant does not necessarily mean decreased sustainability.
Conducting these LCA studies allows users to identify areas for improvement quickly and can quantify the benefits. These calculations can also shed some light on the practices which should be negated to assist in the decarbonization efforts, such as lube oil flushing, as illustrated in Case Study 3.
The carbon footprint of lubricants may seem small, especially if one does not consider “product use” in LCA equations. However, tribology, in general, can tremendously impact lowering society’s carbon footprint. A report to ARPA-E in 2017 calculated that 24% of energy could be saved annually through tribology efforts12. Measuring these efforts start with cradle-to-grave Life Cycle Assessments.
References:
[1] https://en.wikipedia.org/wiki/Life-cycle_assessment
[2] “A Global Comparison of the Life-Cycle Greenhouse Gas Emissions of Combustion Engie and Electric Passenger Cars” Bieker, G., ICCT, https://theicct.org/sites/default/files/publications/Global-LCA-passenger-cars-jul2021_0.pdf
[3] Cradle-to-grave LCA performed by Fluitec
[4] “LCA of petroleum-based lubricants: state of art and inclusion of additives,” A. Raimondi et al. The International Journal of Life Cycle Assessment, 17, 8, 987-996, 2012, DOI: 10.1007/s11367-012-0437-4
[5] “LCA of petroleum-based lubricants: state of art and inclusion of additives,” A. Raimondi et al. The International Journal of Life Cycle Assessment, 17, 8, 987-996, 2012, DOI: 10.1007/s11367-012-0437-4
[6] Wernet, G., Bauer, C., Steubing, B., Reinhard, J., Moreno-Ruiz, E., and Weidema, B., 2016. The ecoinvent database version 3 (part I): overview and methodology. The International Journal of Life Cycle Assessment, [online] 21(9), pp.1218–1230.
[7] Taylor, R.I. et al., “Lubricants & Energy Efficiency: Life Cycle Analysis.” Life Cycle Tribology, 2005.
[8] European Patent. International Application Number: PCT/EP2015/068272
[9] Fehrenbach, H. (2005), “Ecological and energetic assessment of re-refining used oils to base oils: Substitution of primarily produced base oils including semi-synthetic and synthetic compounds,” Institut für Energieund Umweltforschung GmbH (IFEU), a study commissioned by GEIR-Groupement Européen de l’Industrie de la Régénération.
[10] Young, J., Eriksen, E., Pennsylvania Statewide Technical Reference Manual – Work Paper: Energy Efficient Industrial Lubricants: Reducing Energy Consumption with Industrial Lubricants, https://www.puc.pa.gov/pcdocs/1687236.pdf
[11] https://www.epa.gov/energy/greenhouse-gas-equivalencies-calculator#results
[12] “Tribology Opportunities for Enhancing America’s Energy Efficiency,” A Report to the Advanced Research Projects Agency-Energy at the US Department of Energy, February 14, 2017