Turbine oils are required for some of the most complex pieces of turbomachinery equipment. Ideally, users should spend a great deal of time when selecting the right turbine oil, as an inappropriate selection could lead to significant undesired downtime.
However, this is only sometimes the case, and quite often, the selection is made based on the initial purchase cost of the product rather than the total cost of ownership of the product.
When evaluating turbine oils, it can be relatively easy to compare TDS (Technical Data Sheets) and choose the highest or lowest values depending on the data given for the test. However, the main objective of any turbine oil user is to have an oil that provides the recommended performance while also having longevity in the field, not just on paper.
Traditional Test Methods
Most turbine oils meet particular OEM specifications and have undergone some accelerated aging tests, which include:
- ASTM D943 – Standard Test Method for Oxidation Characteristics of inhibited mineral oils
- ASTM D2272 – Standard Test for oxidation Stability of Steam Turbine Oils by Rotating Pressure Vessel
- ASTM D4310 – Standard Test for Determination of Sludging and Corrosion Tendencies of Inhibited Mineral Oils
- ASTM D6186 – Oxidation Induction Time of Lubricating Oils by Pressure Differential Scanning Calorimetry (PDSC)
All of these tests have one thing in common, they all exert oxidative stress on the turbine oil, but this does not predict the performance of the oil in the field as there are multiple degradation methods. As such, to properly evaluate the performance of a turbine oil, one should measure both the oil’s oxidative performance and varnishing tendencies.
There is one ASTM test that measures both characteristics, namely, ASTM D7873 – Standard test method for determination of Oxidation Stability and Insolubles formation of Inhibited Turbine oils at 120°C without the inclusion of water (Dry TOST Method). However, its reporting method cannot be easily translated to performance in the field.
By using the same accelerated oxidative process as specified in ASTM D7873 alongside standardized test methods such as MPC, RULER, and RPVOT, the results and findings can be correlated to actual field performance. This can be done by utilizing the TOPP (Turbine Oil Performance Prediction) test.
Overview Of the TOPP Test
The following is a general overview of the TOPP test conditions:
- Four 350-ml samples of new turbine oil are placed in glass test cells containing a steel/copper coiled wire catalyst conforming to ASTM D5846 specification.
- The test cells containing the turbine oil and catalyst coil are placed into a 120°C (248°F) solid-block temperature bath.
- The samples are allowed to equilibrate to 120°C (248°F) for 20 minutes.
After equilibration, dry atmospheric air is bubbled through the test oil at a rate of 3 L/hr to accelerate aging throughout the test.
- One sample cell is removed at three-, six-, nine-, and twelve-week intervals for testing.
- After each stress period, testing includes:
- Viscosity, 40°C: ASTM D445
- Acid number, mg KOH/g: ASTM D664
- Rotating pressure vessel oxidation test, minutes: ASTM D2272
- RULER, antioxidant health, ASTM D6971
- Membrane patch colorimetry, ΔE, ASTM D7843
- These results are compared with, and trended against, test data obtained as a baseline for the new oil (Week 0).
As noted, results are documented at the 3, 6, 9, and 12-week intervals, which are compared to the baseline for new oil (week 0).
Key Takeaways from the TOPP Test
There is minimal change to the viscosity and acid number of the tested turbine oils throughout the twelve weeks. This is consistent with what is noted in the field: the changes in viscosity and acid number are not directly related to the formation of varnish deposits or oxidation. The figure below shows the comparative performance for 14 commercially available turbine oil formulations.
In Figure 1, Oil life corresponds to an average of RPVOT and RULER results at the end of the twelve-week test. At the same time, deposit control represents MPC value. Lastly, varnish production is the visual assessment of the deposits on the glassware after 12 weeks.
Interestingly, most oils show strong oxidative performance but with higher varnish levels! It was also noticed that most of these oils performed strongly in one area but never in both areas (oxidation stability and deposit control).
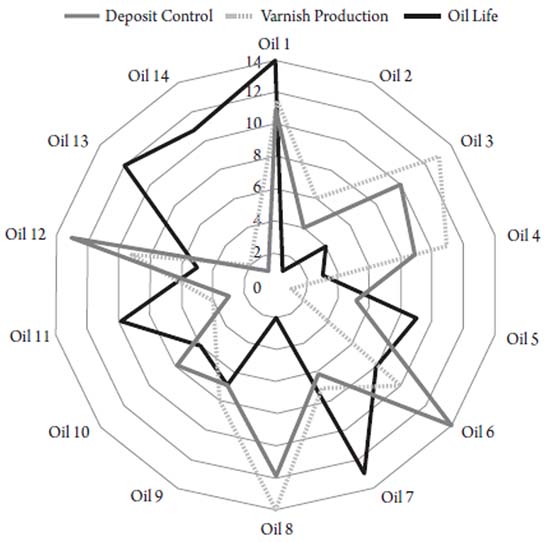
Figure 1: Radar chart comparing the performance of 14 commercially available turbine oils after 12 weeks in a TOPP experiment.
Another interesting finding was that the oil color was not related to the MPC value. Two particular oils had the same color (rated 8, as per ASDTM D1500) but vastly different MPC values of 8 ΔE and 62 ΔE! Color should not be used as an indicator of the health of in-service turbine oil.
No direct and reliable correlation exists between an oil’s initial RPVOT value and the product’s life or its varnish formation and deposit tendencies. The reproducibility of the RPVOT for values over 1000 mins is 22% which is relatively low.
When comparing two turbine oils, it was found that the turbine oil with the higher initial RPVOT declined significantly to 45% after the twelve-week test. On the other hand, the turbine oil with the lower initial RPVOT had a value of 94% at the end of the twelve weeks of testing.
Higher oxidative stability does not translate to fewer deposits being generated. During the twelve-week test, a turbine oil with an initial high RPVOT of 2,796 mins maintained its oxidative stability but produced an MPC of 56 ΔE.
Conversely, a turbine oil with an initial RPVOT of 1,125 mins experiences constant depletion of oxidative stability throughout the test. However, at the end of the twelve weeks, it had an MPC of 8 ΔE. As such, there is no relation between RPVOT and MPC values.
Higher MPC values do not equate to higher levels of degradation.
During the twelve-week test, the MPC value began at 5 ΔE at the baseline for one turbine oil. The value steadily increases to 66 ΔE in week nine and then declines sharply to 36 ΔE in week 12.
However, when comparing the glassware, the visible deposits on the glassware drastically increased between weeks 9 and 12. This indicates that there is an accelerated rate of degradation which is not reflected in the MPC values.
One often assumes that the MPC of a new oil should be particularly low. This is only sometimes the case, as shown below. As such, one should always document the baseline MPC before beginning any trending as one can falsely assume that the oil has increased its varnish potential.
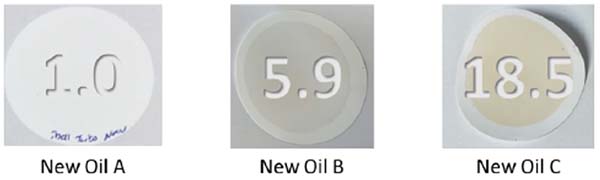
Figure 2: MPC values of 3 types of new turbine oils.
Varnish can drop out of solution when the varnish levels surpass the oil’s carrying capacity (solubility). This can occur especially in areas where oil coolers are present, or there are higher delta temperatures.
When samples are taken for analysis, these are usually areas where the oil is well mixed, not in low oil circulation areas where varnish may have deposited. This can lead to the MPC being an inaccurate measurement for varnish.
The lack of relationship between the MPC patch test and the deposit formation can be seen below in Figure 3.
The oil on the left has a lower MPC. Still, it has more significant deposits on the glassware than the oil on the right, which has a higher MPC value but fewer deposits. Hence, MPC alone should not be used as the only method to measure varnish formation in the oil.
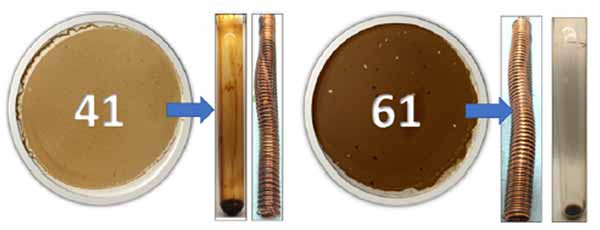
Figure 3: Lack of relationship between MPC and varnish deposits for two oils.
The Decision Matrix
After performing the TOPP test on various oils for twelve weeks, there is a model which can be used to aid in deciding which turbine oil should be used. It is beneficial to benchmark the various formulations through the prioritization of data of the highest importance and the establishment of weighted criteria.
Depending on the application, this decision matrix can be customized. If the system’s reliability is critical, then varnish production may be the most essential criterion to weigh. On the other hand, oil life can be of the highest importance to the customer if they already use varnish mitigation technology; thus, deposits are not their deepest concern.
Figure 4 shows an example of four criteria that can be used to help benchmark and select turbine oils.
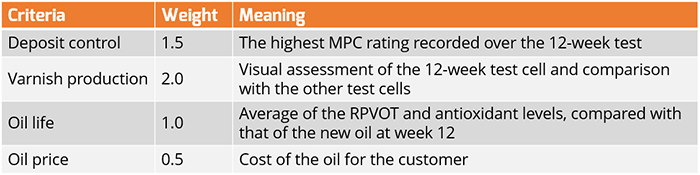
Figure 4: Example of criteria used to benchmark turbine oils.
The TOPP test results can be evaluated, compared, and compared with each other to develop a ranking for each of the oils. Finally, the values can be multiplied by the established criteria weight to determine the overall rank, as seen in Figure 5 below.
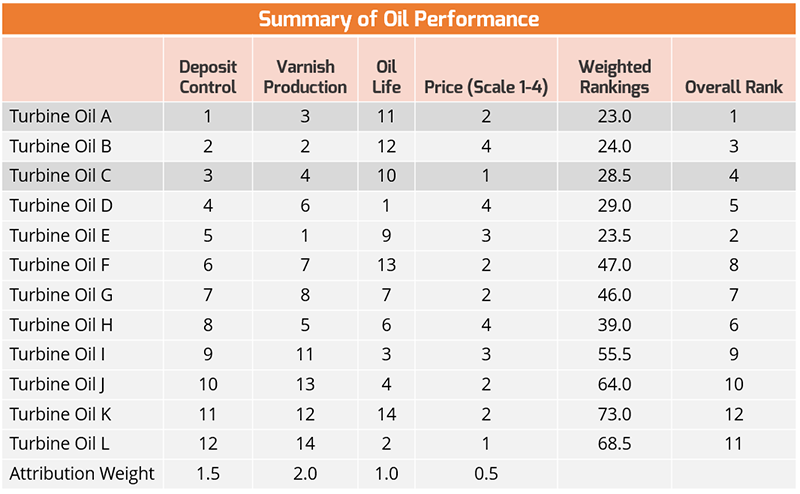
Figure 5: Example of the decision matrix with the assigned rankings.
No single characteristic accurately relates to the field performance of a turbine oil. As such, a decision matrix should be used when selecting a turbine oil for turbomachinery assets to ensure that the oil chosen can be ideally suited for the application.
Selecting a turbine oil based on physical values in its product data sheet or marketing claims is not an effective purchasing decision. Nor is there a correlation between the price of an oil and its field performance.
The best method for selecting turbine oils is to generate comparative test data in a controlled experiment—test turbine oils by stressing the oil following ASTM D7873’s procedure. Standard lubricant condition monitoring tests then analyze samples pulled after 3, 6, 9, and 12 weeks.
Throughout a 12-week aging period, the only significant changes in oil properties are its oxidation stability and varnish potential. Therefore, the tests that provide the most revealing data are the RULER (ASTM D6971), MPC (ASTM D7843), and RPVOT (ASTM D2272).
Many things have been learned by performing this test, such as:
- There are significant performance differences between formulations.
- Formulating an oil with both long-life and low deposits has been a challenge. However, the rate of improvement in both properties suggests that this elusive goal will be met soon.
- The color of the oil is not related to its performance or varnish tendencies.
- Initial RPVOT value doesn’t necessarily determine the life of the oil or deposit control characteristics. An oil’s RPVOT retention properties are more important to track.
- A higher MPC doesn’t necessarily mean more degradation or more deposits. An MPC greater than 30 suggests that the oil is susceptible to forming deposits and warrants attention.
Finally, a Decision Matrix can be made from the test data and the various performance criterion weighted based on a customer’s application and needs. This allows various oil formulations to be benchmarked and provides a better selection guide for purchasing new turbine oils.
Elona Rista presented this paper at Oildoc Conference in May 2023
This paper is also an excerpt from the book, “Preventing Turbomachinery ‘Cholesterol’ – The Story of Varnish” by Greg Livingstone and Sanya Mathura, published by Industrial Press.