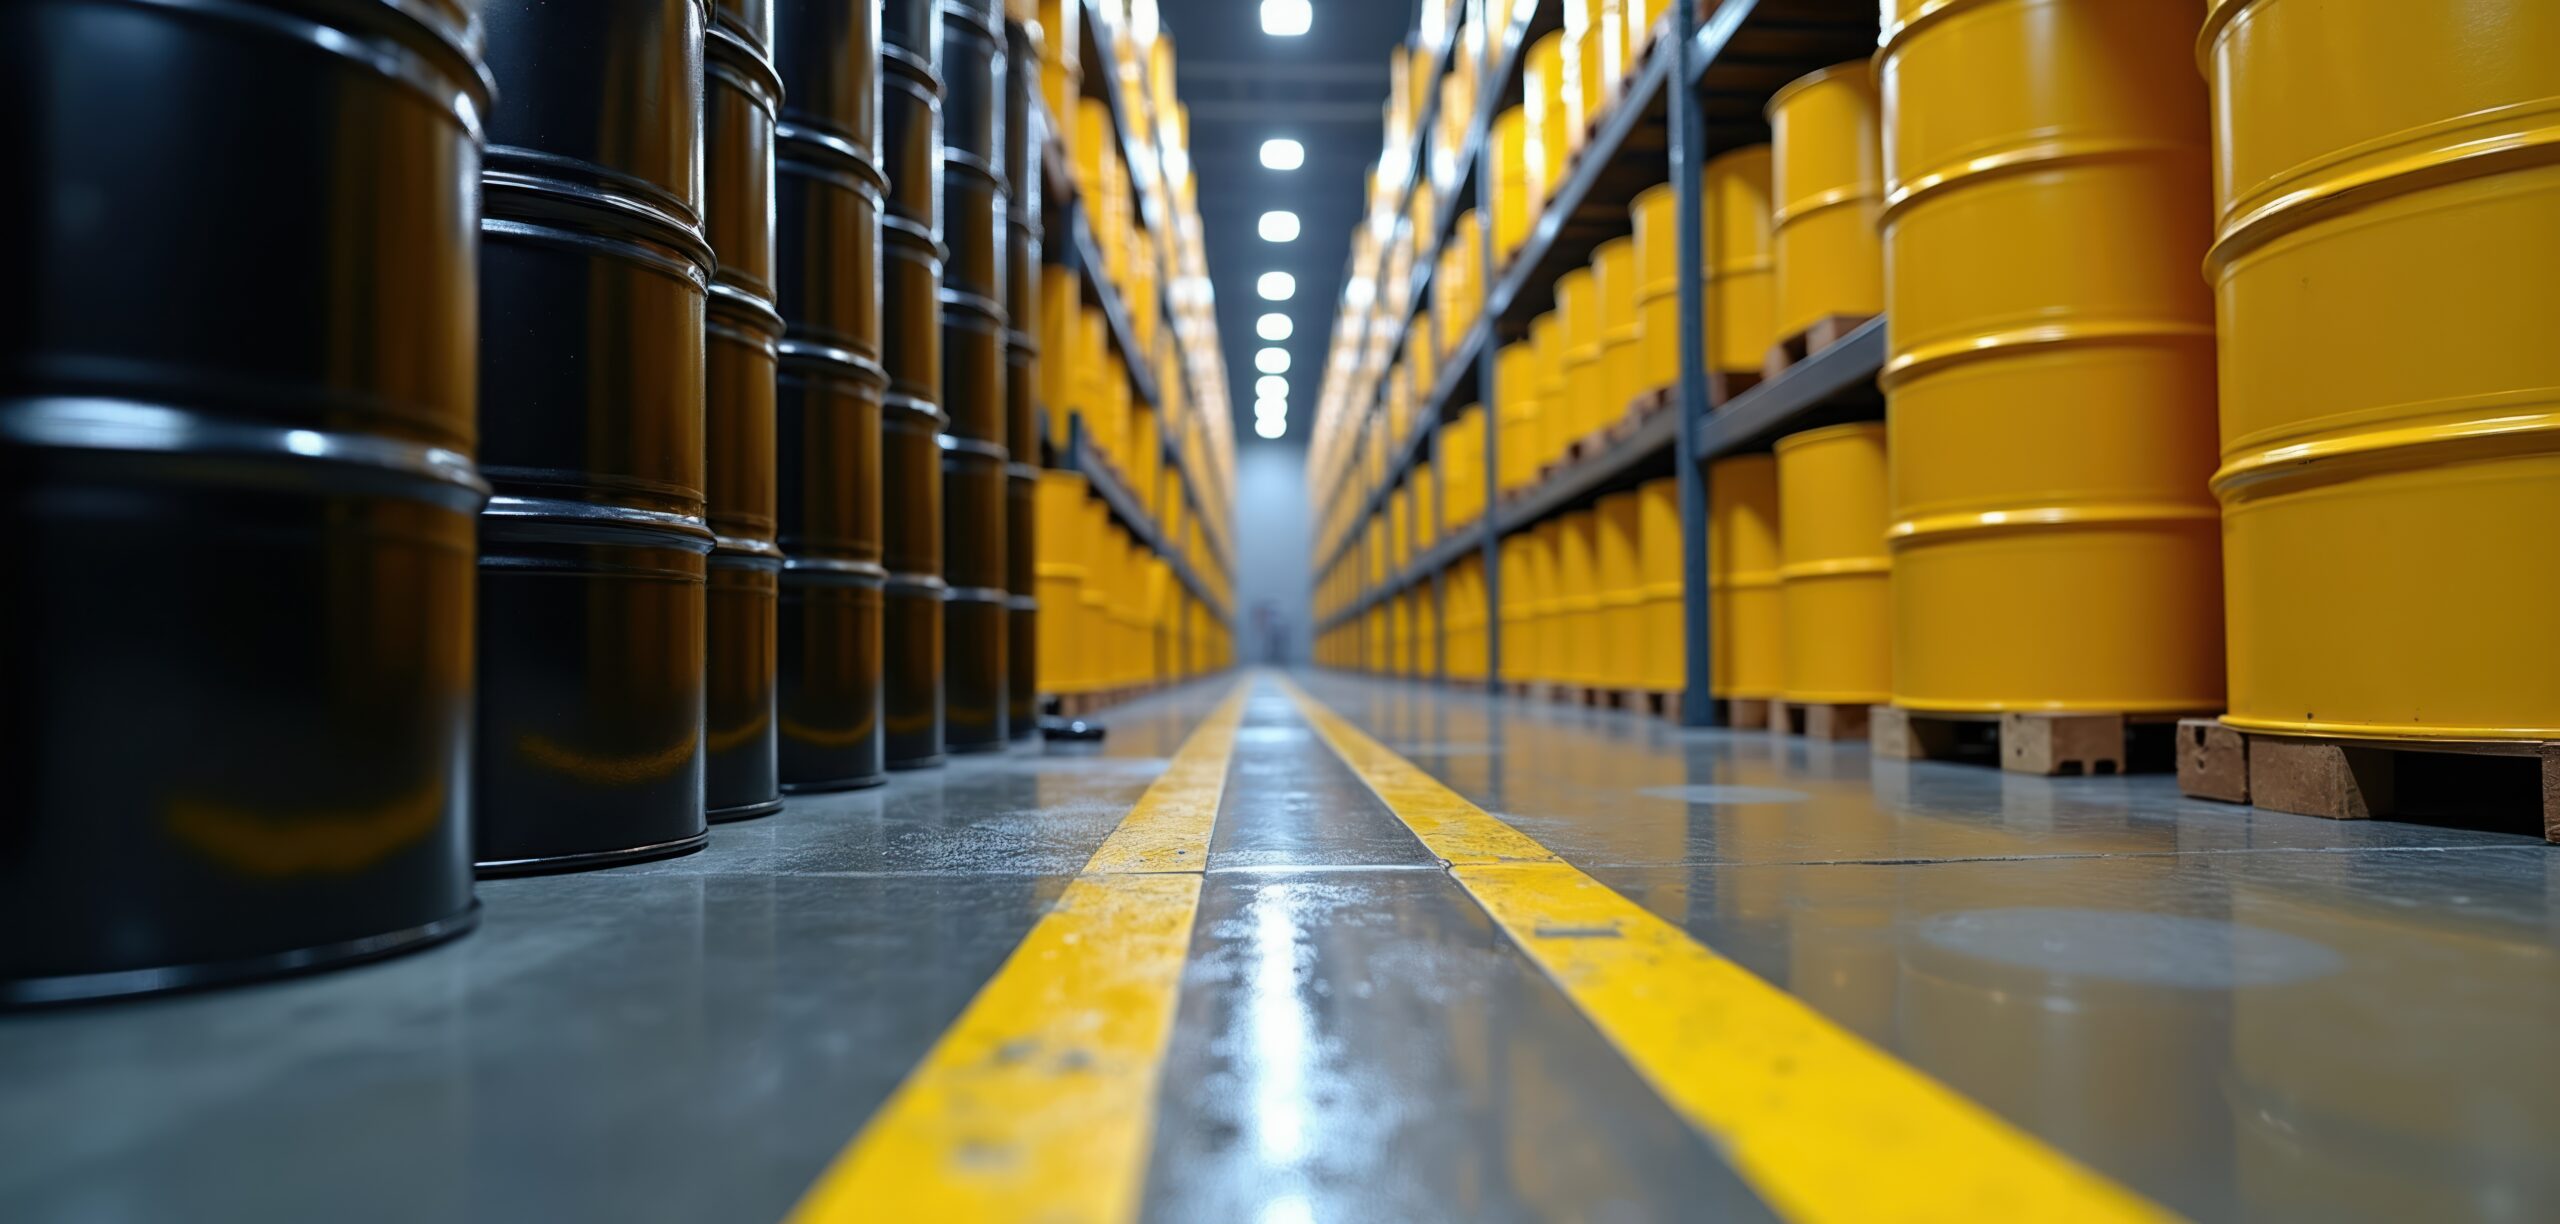
Most industrial oils, when new, have a clear, translucent color. This typical color is maintained for a period while the product is in its original container and free of harmful effects. However, once the oil is put into service, it undergoes changes that are initially chemical due to factors such as the operating temperature, the operating environment, the conditions of the equipment, the content of the tank, and the system where it works.
The first noticeable change in the eyes of the lube technician is the color. A high percentage of oils undergo a color change after a few hours in service, and as the service life of the oil elapses, the color may move further away from its original state. What is this color change due to? Is it normal for the oil to change color? When is the change of color an indicator of a problem?
These are some questions that many lubrication and oil analysis managers have asked themselves at some point and generate many doubts.
The picture below perfectly describes the doubts suffered by the technician in charge of lubrication in the first instance and the proper management of lubrication later.
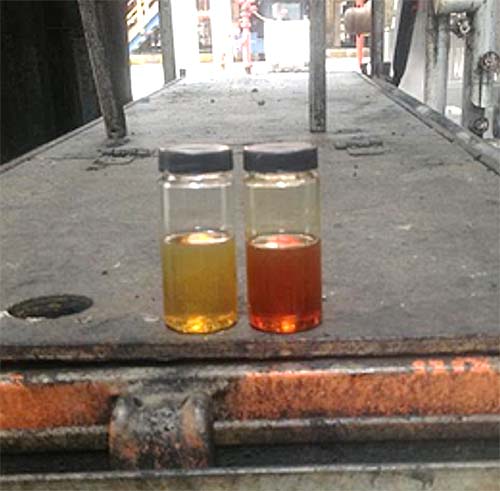
The sample on the left was taken from the free side bearing, while the sample on the right is from the coupling side bearing. The color of both samples is entirely different to the naked eye, but what is the difference between the two?
Laboratory Color Analysis and Current Alternatives
One of the most common routine tests in commercial laboratories is the application of ASTM D1500 (Standard Test Method for ASTM Color of Petroleum Products), where the sample is visually compared against a standard, but it is still a subjective comparison.
The difference is evident in the examples in the photo above, and the samples receive different classifications. However, the doubt remains; Do any samples have signs of deterioration?
Alternatives vary by lab and often range from simple definitions like “dark” or “light” to more precise ones where the lab analyst compares the sample against a color palette.
Although these methods have a procedure, the margin of error is usually large since, for one technician, the sample may be “dark.” In contrast, for another technician, the same sample may be “slightly dark.” We no longer consider the variation that it happens on Monday mornings or Friday afternoons, where the eyes seem to be more tired to opt for a good definition of the color type of the sample.
What Can a Color Sensor Contribute?
I had the opportunity to grow professionally in a research center where we had a lot of resources and knowledge. This allowed me to satisfy many of my doubts and conjectures about what happens to lubricants. Among these, that color changes.
Why does the color of an oil change after a few hours in some cases, while in others, it can remain unchanged for years? What chemical implications does the color change have? And even more critical from an operational point of view, is the color change an indicator that the oil requires corrective maintenance action?
In 2016 I worked on designing a color sensor that could identify those small changes. Although it was the first big step to understanding what happens when the oil changes color, it was imminent that it needed to rely on other techniques to validate what was happening with the oil.
This sensor traversed the visible spectrum, simultaneously comparing each measurement against two different sources. A previously loaded blank and the darkest color were recorded throughout the measurement.
The sensor made 800 to 1,200 measurements of a sample in about 4 to 9 seconds, depending on the translucency of the sample.
Once all the points had been analyzed, the software allowed a value or a range to be given in some cases, which could be later worked on, analyzed, and compared for more specific purposes and to determine if the color indicated a change that could harm the oil.
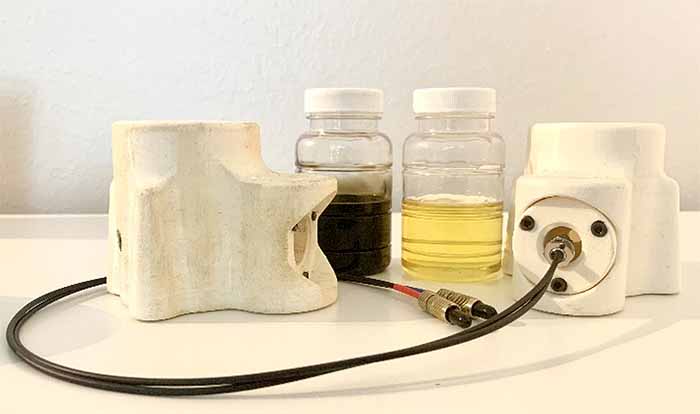
Sensor Probe JAB-01 & 02
Applicability
Rationally the main limitation of color sensors is the opacity of the sample. Very dark samples do not emit significant results that can be contrasted or are effective when determining the state. This is mainly because the sample entirely absorbs the light beam emitted by the sensor and does not emit any pulse that can be compared or analyzed.
Thus, this type of sensor has a much broader application in industrial oils such as hydraulics, gears, turbines, and compressors.
The sample analysis software allows obtaining results in any of the following options:
- Chromatic scale
- Achromatic scale
- A combination of the two above
- CIElab color
Turbine, compressor, and hydraulic oils are initially translucent and clear, but as they change chemically, they tend to darken from the point of view of our sense of sight. It was on a group of nearly a thousand samples of these types of oils that the color study focused on.
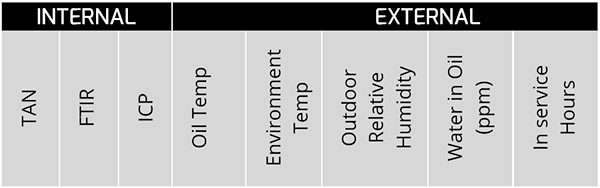
Like any determination of parameters, it is necessary to have a reference to recognize, identify and control that the physical changes are due to a chemical condition. For this case, the acid number (TAN), metal concentration, and measurement by infrared spectrum were used. (FTIR).
On the other hand, the operating conditions were also considered in this case: oil temperature, ambient temperature, ambient humidity, the concentration of water in oil, and hours in service.
Initial Results
Temperature
Temperature is the main factor for the drastic change in the color of the oil. Oil that exhibits color changes induced by temperature effects tends to be reddish amber, and as it remains in service, the reddish color tends to darken further.
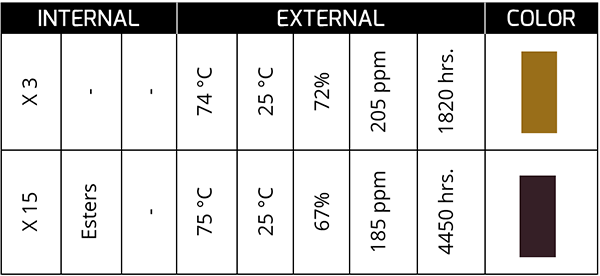
The previous case corresponds to a synthetic oil in a bearing that, at 4450 hours, presents a dark color and with a TAN concentration of 15 times the initial one. The oil was kept in service for ~400 more hours until it was changed.
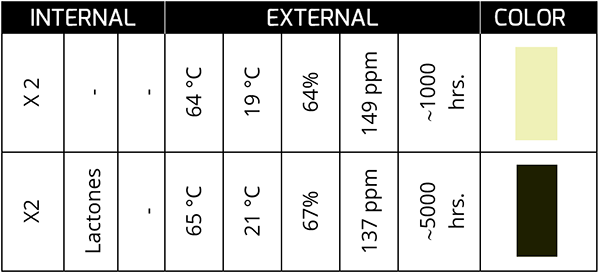
Generation of Chemical Compounds
The chemistry of lubricants is very complex, and, in many cases, neither the mode of formation of certain compounds nor the way to eliminate them has been determined. The acids measured in oil analysis encompass many of these compounds, but logically not all of them, nor does it specifically detail what acids these are, nor does it define whether, in the medium term, they could transform into other, even more harmful compounds.
In the following case, we will see that the measured levels of AN are very similar.
However, compounds such as succinimides and lactones (~1700 cm-1) are clear indicators of chemical changes that will lead to harmful products for the oil and the active ingredient later.
This case is very typical in gas turbine and compressor oils with varnishes that affect the availability of the asset. Despite carrying out constant filtration to eliminate the varnish – with the expense that this entails – it is impossible to stop the origin of the problem, which is the loss of a compound that, for the reader’s better understanding, we will define as an additive! From the base!
This compound has been reduced to such an extent that it cannot release the air trapped by the agitation of the fluid in high-pressure areas, generating implosions that crack the lubricant, forming organic by-products that will later be measured as varnishes. Of course, only a handful of laboratories in the world can determine the origin of the problem. Measuring the varnish is simple; determining its origin is another matter.
Presence of Water
Water is a common compound in lubricating oils, not only because they are very similar to it but because it is part of its chemistry, and depending on the type of oil, it may contain more or less water molecules.
Fortunately, just as it is easy to retain water, its physicochemical characteristics can also include it without showing drastic changes. However, one of the most aggressive effects is due to hydrogen and not water, but we will talk about the effect of hydrogen in another article.
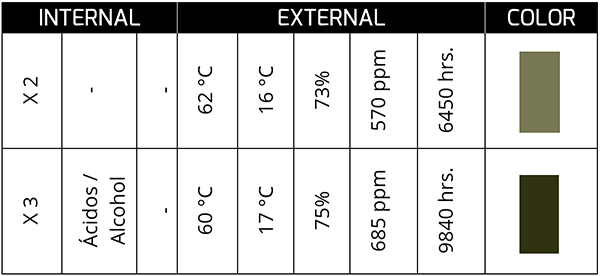
This sample corresponds to synthetic oil in a bearing from a plant with a high presence of process water. Although acid generation is not extreme (low TAN), the presence of water can change the color of the oil as both are in service; This is what I mean by the constant movement or agitation that the oil-water fluid undergoes.
At the end of its service life, the oil tends to show a dark greenish color, and, in some cases, it is associated with the formation of sludge with a low acid concentration. On the other hand, a high acid concentration (high TAN) in the presence of water can generate colors that, to our eyes, tend more toward the yellow spectrum. In appearance, they tend to be lighter rather than darker.
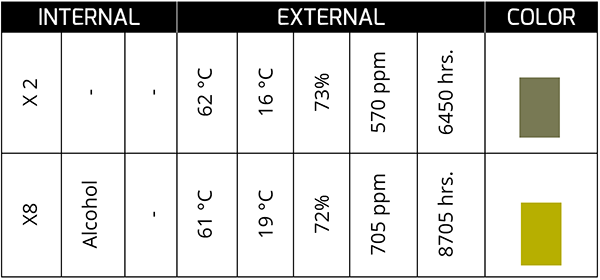
The color change is a conclusive indicator of a chemical process that gave birth to a physical change in the oil. It is not always bad, but it is necessary to understand what the color change implies since each machine-oil unit dances to its own rhythm. Do you understand the rhythm of your assets?