In the late 1980s, I took one of the hardest courses of my graduate studies – quantum mechanics. Quantum mechanics is the physics and math behind how all matter is formed and interacts with the world around it.
Amongst other things, quantum mechanics can answer some of the most complex questions, such as “How was the universe formed” or some of the most basic, such as “Why is the sky blue”?
Central to quantum theory is the idea that atoms, molecules, and sub-atomic particles such as electrons and protons can be described as both a particle and a wave. If that’s not strange enough, how we detect these entities determines their behavior.
Try to detect an electron as a particle, and it will exhibit mass and momentum. Try to detect it as a wave, and it will exhibit a wavelength and amplitude. In quantum mechanics, this concept is often referred to as wave-particle duality.
Fast forward 35 years, and I face yet another conundrum involving particles. Why do samples of oils that appear to be clean show high particle counts, and why do oils that appear to be contaminated show low particle counts? Just like wave-particle duality, the answer lies in how we measure particle contamination.
Optical Particle Counting
Most lab-based particle counts are performed using optical particle counters. Optical particle counters use a laser imaged through a flow cell and an optical sensor to measure the amount of scatter from the sample.
As the oil sample flows through the cell, any particles entrained in the sample will scatter the laser light, with the amount of scatter proportional to the size of the particle. Per the ISO 4406 standard, particle concentrations are reported as particles greater than 4 microns, particles greater than 6 microns, and particles greater than 14 microns per milliliter of fluid (Figure 1).
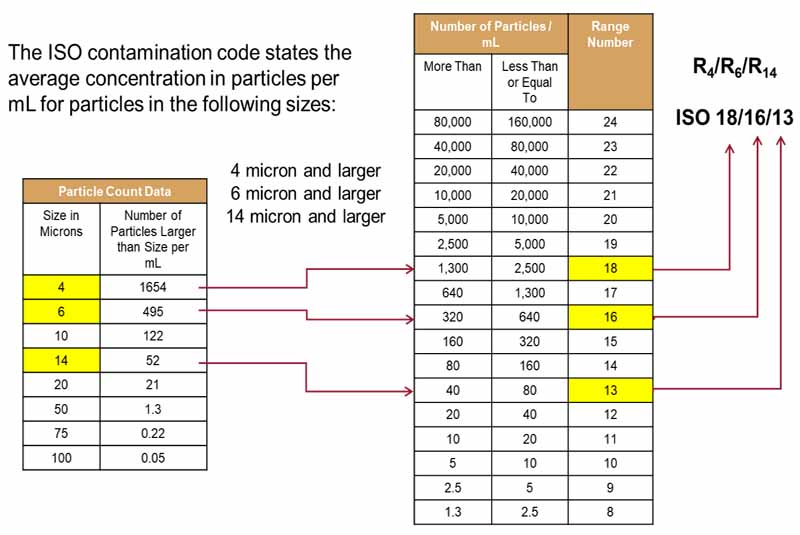
Figure 1: ISO 4406 Particle Count Standard
But herein lies our first conundrum. How can a 3-dimensional particle be measured and reported in a simple linear unit – microns? The reason is simplicity and how particle size is being measured.
Since we are imaging the particle from one direction, measuring the total volume of any particle in an oil sample is impossible. Instead, particle counters are calibrated to report particles based on their “equivalent spherical diameter.”
In essence, what size (diameter) of the perfect sphere would produce the same amount of scatter as the optical particle counter measures when a particle passes through the detection zone?
This can lead to significant variability in how any particle is measured. For example, consider a particle 20 microns long, 5 microns wide, and 1 micron thick. How big is the particle when measured using an optical particle counter? Just like wave-particle duality, the answer depends on how we measure it.
If the particle is oriented with its two smallest axes toward the sensor, the equivalent spherical diameter might be 2.5 microns. By contrast, if the particle is aligned with its two major axes towards the sensor, the equal spherical diameter would be 11 microns, a difference of almost five times (Figure 2)!
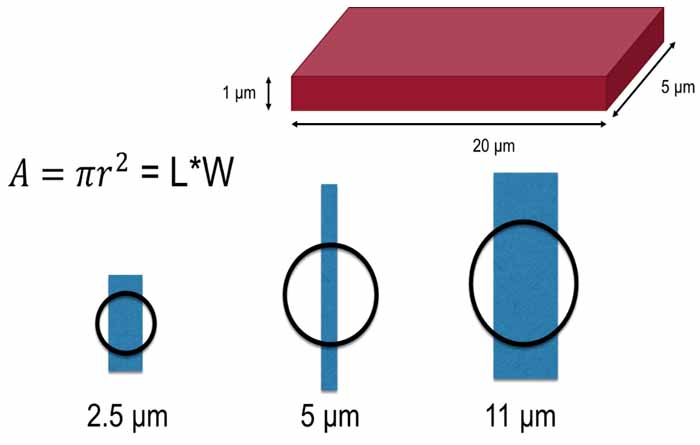
Figure 2: Equivalent spherical diameter of particles measured by optical particle counting.
But it’s not just particle orientation that impacts particle counts. Particle color and type will also have an effect. A shiny metal particle will likely scatter far more laser light than a dull black particle. As such, the metal particle will likely be reported as bigger than the dull, black particle, even if they are the same size.
Fluid color can also impact the reported particle count.
While some optical particle counters account for fluid color, others do not, creating differences in how fluid cleanliness is reported in light versus dark-colored fluids. So, too, fluid type can impact particle counting. Some new oils that have been pre-filtered and contain very few contaminant particles can show a high particle count based on additive composition.
Heavily additized oils such as engine oils and tractor fluids have such a high concentration of additives that they can form an additive “floc.” In essence, a raft of additives stuck together that, while not a solid particle, can impact the amount of laser scatter and hence the reported particle count. For this reason, heavily additized oils will always show a higher particle count even if they are very clean.
Water and other aqueous contaminants can also impact particle count. Imagine driving in traffic on a foggy night, staring into oncoming traffic with their headlights on high beam. The fog – a suspension of tiny water droplets in the air will scatter the light from the headlights, momentarily blinding us.
Likewise, suppose an oil has a high-water content, and the water is suspended throughout the sample as a stable emulsion. In that case, the emulsified water droplets will scatter the laser light, “blinding” the optical sensor.
We often see fluid cleanliness reported as 24/24/24 for oil samples heavily contaminated with water. While this may mean the oil is very dirty, it may also indicate that the sample contains free or emulsified water.
Fluid age can have an impact on particle counting.
As oil degrades, by-products of oil degradation form soluble and insoluble deposits within the oil. While these may be dissolved in the oil when the oil is at operating temperatures, in the lab, where particle counts are done at ambient room temperature, these by-products can be measured as particles by an OPC.
Phantom particles from additive floc or oil degradation by-products are often called “soft particles” since they are not particles in the same sense as dirt or metallic wear particles.
The presence of soft particles can sometimes indicate an increase in varnish potential. Particularly in hydraulic fluids, whenever the 4 and 6-micron particle count is more than five or six ISO codes higher than the next highest-sized micron count, confirmatory tests such as membrane patch colorimetry (MPC) should be performed to measure for varnish potential (Figure 3).
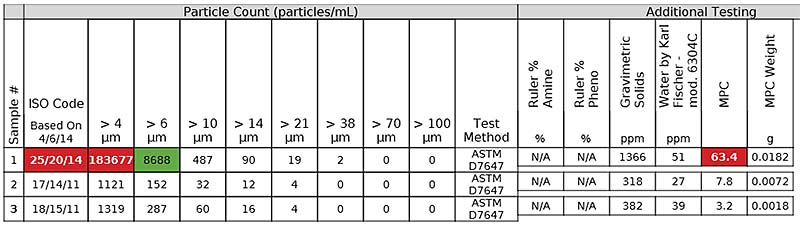
Figure 3: Oil sample showing “soft” particle contamination due to high varnish potential.
Of course, labs and instrument manufacturers know how fluid color, additives, soft particles, and water can impact particle counts. ASTM D7647 has been developed to offset the impact of false readings.
The standard allows for samples to be diluted using several different solvents to mask the effect of color, water, and soft particles allowing a more representative estimate of solid particle contamination to be made.
The type of particle counter can also impact the reported ISO code. While most commercial labs use optical laser particle counters, which should yield comparable results, some field instruments and inline particle count sensors can provide very different results.
Inline sensors often use a laser diode to image particles as they pass through the sensor. Instead of measuring laser scatter, these instruments rely on light blockage. When no particle is present, 100% of the diode light hits the optical sensor.
As a particle passes through the detection zone, the instrument records the “shadow” cast by the particle as a reduction in light intensity. The amount of light blockage is directly proportional to the size of the particle.
While conceptually, this makes sense if the fluid is very clean or the particle is tiny, measuring just a small reduction in light intensity in an overall high background can result in the under-reporting of small particles and hence a lower-than-expected ISO code. For this reason, it can sometimes be difficult to correlate lab-based particle counts with inline sensor particle counts (Figure 4).
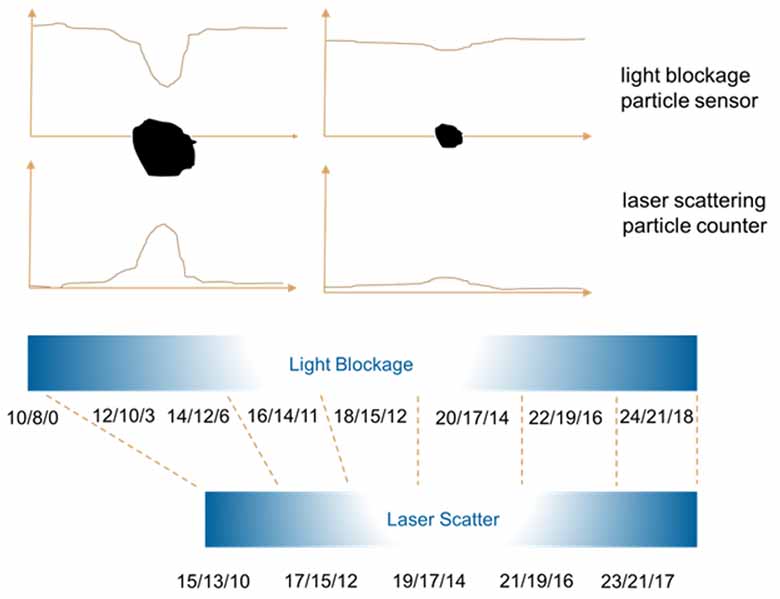
Figure 4: Comparison of the impact of light scatter versus light blockage particle counting.
Because of contamination’s impact on equipment reliability, ISO particle counting should be a routine part of every reliability-focused oil analysis program. But it should be used with caution. It should never be considered an absolute measure of the actual size and concentration of particles contained within the oil.
Instead, it is a trending tool that allows us to recognize when a machine is in danger of particle-induced problems. So, it will enable us to make critical decisions around filter and filtration selection.
But don’t be fooled; high particle counts don’t always mean the oil is dirty and machine failure is imminent, while a low count does not guarantee clean oil. Like wave-particle duality and quantum mechanics, everything might not be as it seems!