


Imagine two turbine oils that came off the same accelerated aging protocol. They used the same rig, temperature, catalysts and air flow. We then ran both through Membrane Patch Colorimetry, and the results were so close that any laboratory would call them equivalent.
One returned an MPC of 36, the other 35, and both counted as critical. As a result, any analyst would rate the deposit potential of those two samples identically.
Then we looked at the glassware.
The first vessel was clean. A black reference stripe ran across the tube. Through the glass wall, you could read that stripe as clearly as outside the glass.
The second vessel, however, had a coat of deposits. The stripe had disappeared behind an opaque film. Even after a non-polar solvent rinse, the film was still there, chemically bound to the wall.
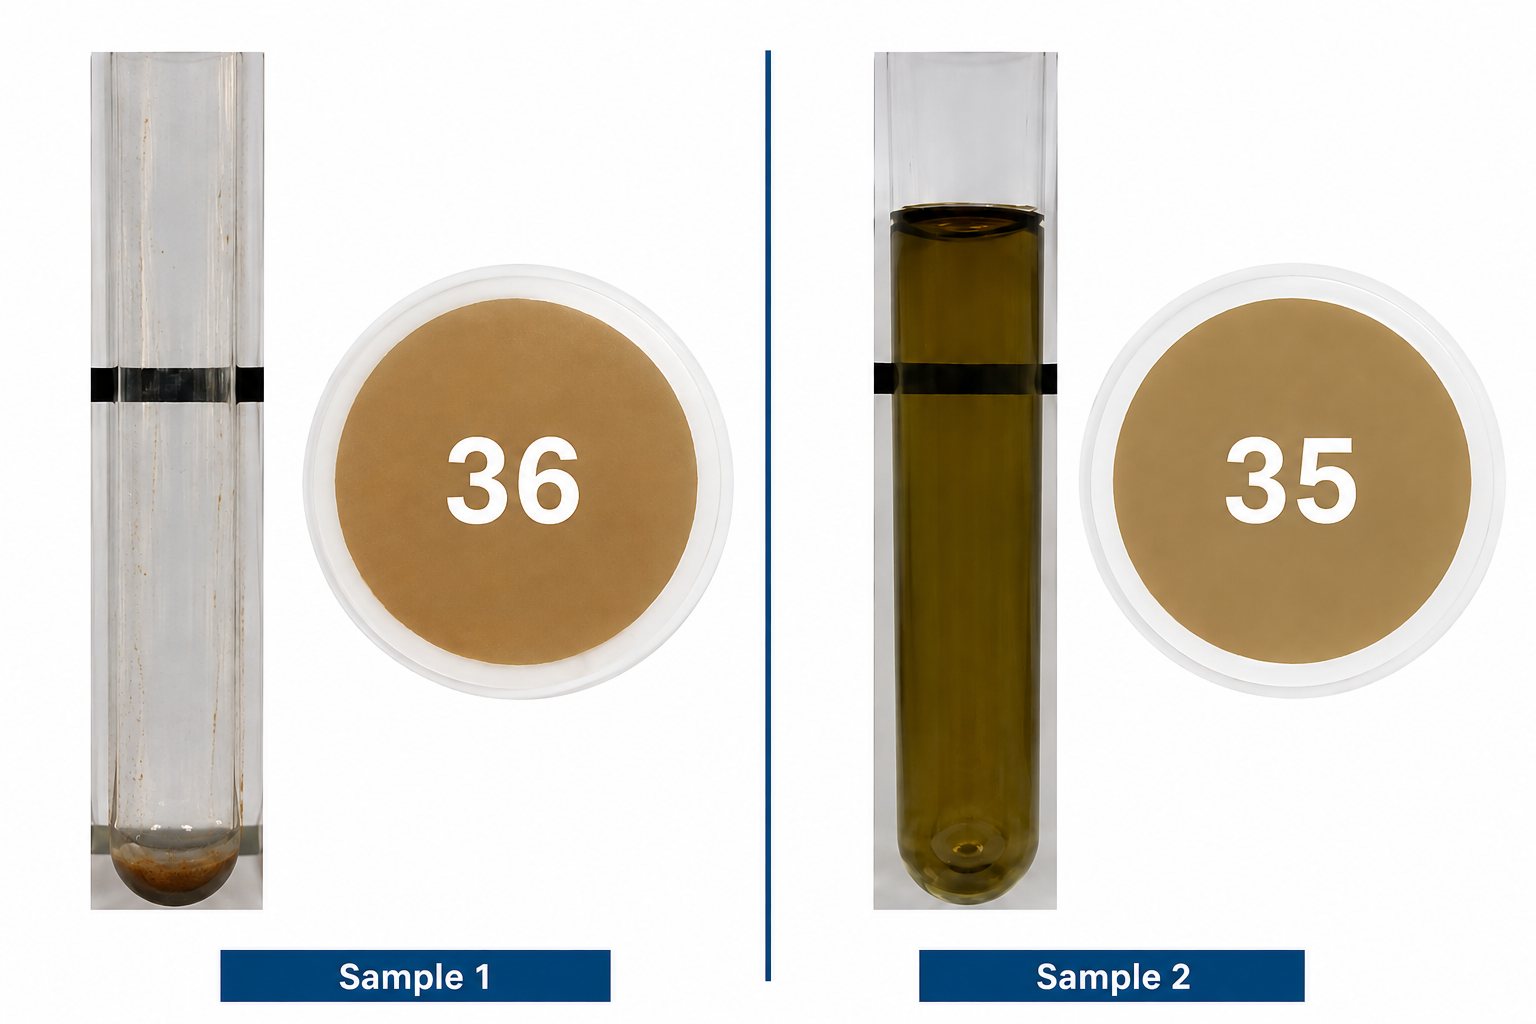
Figure 1: Two images of glassware from the TOPP test after rinsing. Both have similar MPC values, but dramatically different deposit levels on the glass.
Same colorimetry result. Opposite deposit results.
Not an Outlier
That pair is not an outlier. Our twelve-week aging study covered 52 turbine oils. Among them, the specimens with an MPC between 25 and 40 spanned the full range of deposits.
Some vessels were spotless, while others were completely obscured. In other words, the MPC value told us almost nothing about what was on the surface.
52
Turbine oils in the aging study
12 weeks
Each oil spends in the TOPP test
87×
Deposit yield per unit of MPC, highest oil vs. lowest
Two Dimensions of Deposit Potential
Deposit potential therefore has two dimensions. The first is what the fluid still holds in solution, and MPC measures this well. The second is what has already left solution and bound itself to a surface.
Nothing in the standard test slate measures that second dimension at all.
This article explains how we assess it. It also shows how we turned a photograph of a test vessel into two reproducible numbers. Finally, it covers what those numbers tell you that the patch cannot.
What the Patch Actually Tells You
Membrane Patch Colorimetry came out of an ASTM subcommittee that began work in 2006. ASTM then published it as D7843 in 2012. Before that, the industry had no repeatable way to put a number on varnish potential.
Ultracentrifuge ratings depended on the operator and had no standard, and analysts read patch tests by eye. D7843 gave laboratories a three-day procedure. It also gave reliability engineers a number they could trend.
D7843 changed how the industry understands and predicts varnish.
How the MPC Test Works
First, the laboratory holds a sample of in-service oil at room temperature in the dark for 72 hours. Next, it dilutes the sample with a non-polar solvent. Then it vacuum filters the mix through a 0.45-micron nitrocellulose membrane.
Once the patch is dry, a spectrophotometer reads it in CIE L*a*b* space. The lab reports the result as ΔE, a single distance from a clean reference patch.
Reading the Patch in CIE L*a*b*
What Is CIE L*a*b*?
CIE L*a*b* is a system for describing any color with three numbers. The International Commission on Illumination (CIE, from its French name Commission Internationale de l’Éclairage) defined it in 1976. People use it wherever color has to be measured rather than judged by eye, from paint matching to food quality control. The asterisks set it apart from an older scale that used the same letters.
Each color gets three coordinates. L* is lightness, running from 0 for black to 100 for white. The a* axis runs from green (negative) to red (positive). The b* axis runs from blue (negative) to yellow (positive). The designers built the space so that equal steps anywhere in it look like roughly equal changes to the human eye.
In the MPC test, a spectrophotometer reads the L*, a* and b* values of the used patch and of a clean reference patch. ΔE (delta E) is the distance between those two points. A clean patch sits near white. As degradation products collect, the patch darkens and shifts toward yellow, orange and brown, and ΔE climbs.
Think of ΔE as the distance between two cities on a map. It tells you how far you traveled but not which direction you went. An intensely yellow patch and a muddy brown one can sit the same distance from white and report the same ΔE. Yet they point to different chemistry. Most instruments record all three coordinates, so ask your laboratory for L*, a* and b* alongside ΔE. That shows which way the oil is moving.
Why the Incubation Period Matters
The incubation period has a purpose. It lets degradation products that barely stay dissolved at operating temperature drop out as the oil cools and sits.
In short, MPC forces precipitation by cooling a static sample in a bottle. It then measures the color of what falls out.
So, in addition to the color of degradation products, MPC also measures the fluid’s solvency.
Video: How the MPC test works (Fluitec)
What Sets the Color on the Patch
Now consider everything that sets the color on that patch. Three parts of the formulation do most of the work.
Base Stock
Group I base oils carry leftover aromatics along with sulfur and nitrogen compounds. These oxidize into dark, strongly absorbing color bodies (polyaromatic chromophores). Hydroprocessing, by contrast, strips most of those species out of Group II and Group III stocks, so they generate fewer and lighter products.
Polyalphaolefins add little color of their own. Esters, meanwhile, break down into acids that are polar but only weakly colored. So the same oxidative severity produces a different ΔE depending on where you started.
Antioxidant Chemistry
This is the largest single variable in the MPC test. Aminic antioxidants are sacrificial by design. When they are consumed, the products they form carry intense color.
For example, alkylated diphenylamines pass through nitroxyl radicals into quinone imines and phenazine-type structures. These are typically deep red to brown. Phenyl-alpha-naphthylamine and its alkylated forms are darker still. Hindered phenols, on the other hand, form quinones and stilbenequinones. Those read yellow to yellow-orange and absorb far less light.
Solubility Enhancers and Co-Base Fluids
Alkylated naphthalenes, oil-soluble polyalkylene glycols and ester co-bases raise the solvency of the finished fluid. Because of this, degradation products that would otherwise fall out during the cool-down stay dissolved. They never reach the patch. The result is the same degradation, but a lower ΔE.
Same Degradation, Different ΔE
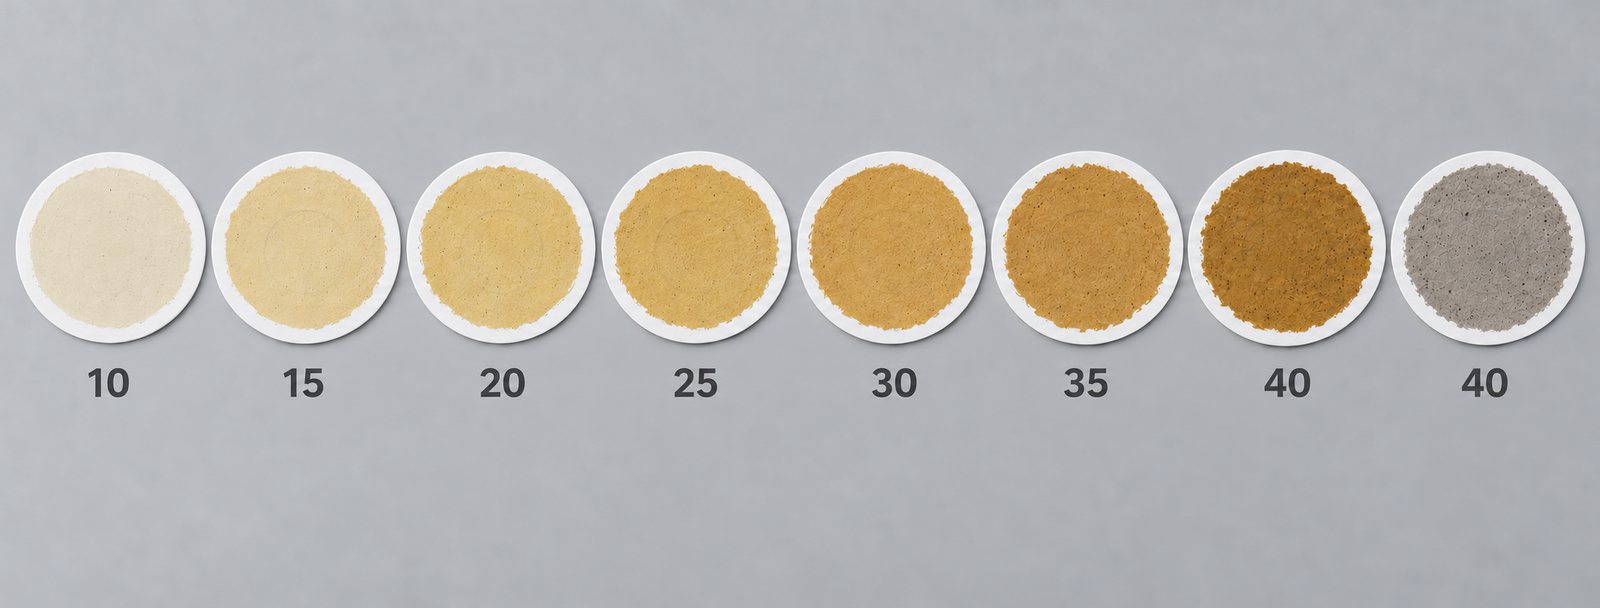
Figure 2: Examples of several MPC patches. A ΔE of 15 and below is normal, whereas 30 and above is critical. Notice the two patches with a ΔE of 40, yet very different colors. The brown patch suggests oxidation, whereas the grey patch suggests inorganic contaminants.
The effect of antioxidant chemistry on patch color is direct. An oil with a heavy aminic package can post a high ΔE while its antioxidant system does exactly what its designers intended. Likewise, two oils at identical depletion, differing only in amine structure, return different hues at different intensities.
Higher solvency, meanwhile, is the intended design outcome and a real engineering benefit. After all, material that stays in solution is material that isn’t depositing on a bearing.
Two things follow. First, ΔE now reports solvency as much as degradation, and the two blur together in one number. Second, several of these components are themselves aromatic, so they oxidize into their own color bodies.
A solubility enhancer can therefore move the number down by holding material in solution. Alternatively, it can move it up by adding new color bodies. The patch cannot tell which happened.
Other Polar Material and the Reporting Convention
Rust inhibitors, metal deactivators and their degradation products are polar, so the membrane captures them too. Water and soft contaminants from outside the fluid also end up on the patch. None of these are varnish precursors, yet all of them move the number.
Then there is the reporting convention itself. ΔE folds lightness, red-green shift and yellow-blue shift into one distance from a reference. As a result, two patches of entirely different hue can return the same value.
None of this criticizes the method as written.
D7843 does what it claims, and it does so reproducibly. Instead, the challenge is interpretation. Labs often apply one universal condemning limit across formulations that produce color by different mechanisms, at different rates, for different reasons.
A Harder Reference Method
The Turbine Oil Performance Prediction (TOPP) test answers a different question. Rather than measuring the color of degradation products, it measures whether the oil forms deposits.
In this test, we hold the oil at 120°C for twelve weeks. Air bubbles through it the whole time, with iron and copper catalysts present. We add no water.
We then pull samples at three, six, nine and twelve weeks. Each sample goes through a full panel that includes MPC, RULER, RPVOT, viscosity, acid number and FTIR, among others.
At the end of the run, the glass vessel itself becomes the specimen.
How TOPP Differs from Dry TOST
TOPP builds on the dry Turbine Oil Stability Test (TOST) concept from Mitsubishi Heavy Industries. ASTM later codified that concept as D7873. That test runs 1,000 hours at 120°C over an iron catalyst, with pure oxygen bubbling through the oil. At the end, it reports total sludge by weight.
TOPP, in contrast, roughly doubles the duration and adds copper. It also samples at intervals rather than only at the finish. Finally, it keeps the vessel so we can assess the surface.
D7873 gives you one number once the run is over. TOPP gives you a trajectory and a surface to analyze.
Why Twelve Weeks Matters
Twelve weeks is a long time for a test. However, cutting it short changes the degradation mechanisms and produces very different results.
We also tested the same fluids at 150, 180 and 195°C. At 120°C, the kinetics are close to linear. As the temperature climbs, that gives way to nonlinear runaway behavior. Both additive and base oil molecules then break down structurally.
A fast test at 195°C tells you how an oil fails at 195°C.
It does not tell you what builds up in a bearing housing over four years. That slow buildup is much closer to what happens in the field.
What the Glass Records That the Fluid Does Not
Deposit formation requires three things in sequence.
Leave Solution
First, the material has to come out of solution. MPC tests only this step, at room temperature in a static bottle.
Reach a Surface
Next, the material has to travel to a surface. No standard fluid test follows it there.
Adhere
Finally, it has to stick. The vessel tests all three steps, at temperature, with air and metal present, over months.
The rinse is what turns the vessel into a deposit measurement rather than another color measurement. After twelve weeks, we rinse the glassware with a non-polar solvent, so anything still soluble washes away. Whatever remains has bound to the glass.
That is a working definition of varnish.
Moreover, it is a physical fact about a surface rather than an inference about a fluid.
What the Field Evidence Shows
OEMs have compared their own oil analysis databases against TOPP outcomes for the same formulations. That comparison tests how well glassware condition tracks field deposits.
Still, the assessment is subjective, because there is no accepted way to measure the degree of deposit in an operating turbine. Every engineer weighs deposits in servo valves, filters, bearings or heat exchangers differently. Each relies on their own experience.
Even so, one consistent direction survives the subjectivity.
Oils that perform well on the TOPP glassware produce far fewer deposits in the field.
When the Patch and the Field Disagree
The reverse case teaches more than the agreement does. One widely used turbine oil has had a field reputation for varnish for years. Its MPC stays low, so conventional oil analysis makes it look like one of the better fluids in service.
The TOPP glassware, however, shows it laying down heavy deposits. In this study, it had the highest deposit yield per unit of MPC of all fluids tested. That was roughly 87 times the yield of the lowest. Here, field experience and the glassware agree with one another.
There is also an argument from perception. It isn’t scientific, but it matters in practice. When end users look at the glassware, they recognize their own machines. They have seen that film on a bearing housing and inside a servo valve. A ΔE of 33, by contrast, triggers no such recognition.
Nobody has ever pulled a reservoir cover and found a 33.
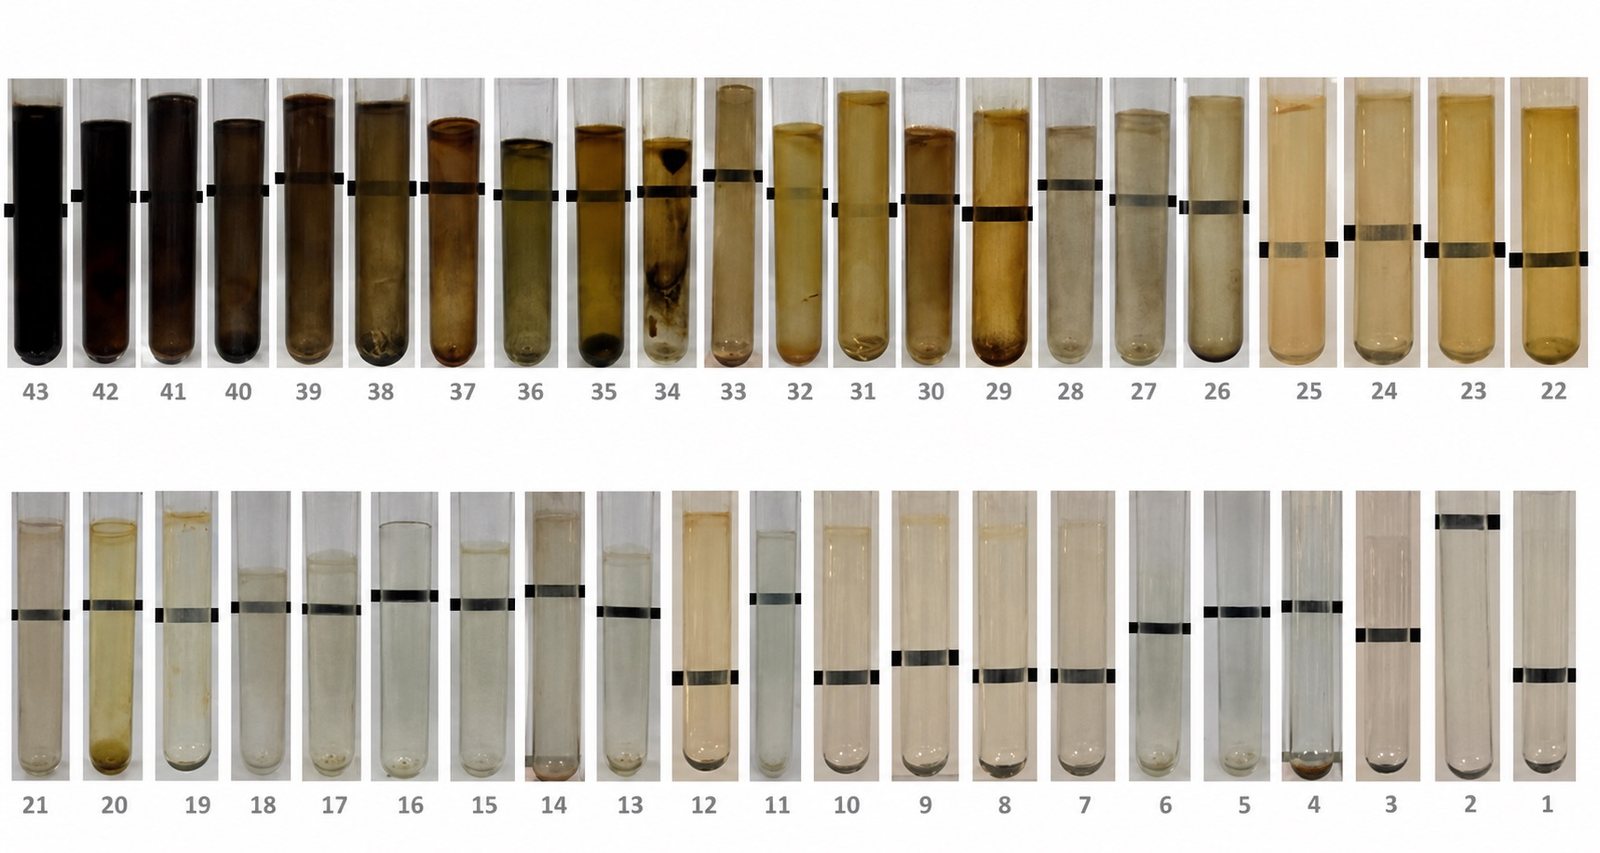
Figure 3: Various commercial turbine oils after twelve weeks in the TOPP test, showing very different deposit control results.
Making the Glassware a Measurement
A photograph of a dirty tube is persuasive, but it is not a measurement. For most of the history of this work, we ranked the vessels by eye. The ranking then depended on who was holding the glassware.
We have now developed a method to digitize the glassware assessment. In fact, the procedure is simple enough that any laboratory can reproduce it.
First, we photograph each vessel in a lightbox against a uniform background. A black reference stripe crosses the tube. Part of the stripe sits behind the glass wall, and part sits beside it.
From each photo, we extract two scores: color and opacity. Each uses a 0 to 100 scale, where 100 is worst.
Each Image Calibrates Itself
Every score is normalized against its own image.
The reference range for a photograph runs from the background to the darkest pixel of the stripe outside the glass. We then express every distance as a fraction of that range. This detail is what makes the method practical.
Because each image calibrates itself, lighting differences cancel out. We never need to photograph vessels together or compare them against one another to score them. Therefore, a tube run in 2019 and a tube run last week are directly comparable.
The Color Score
The color score is the median of 100 pixels, sampled at random through the glass wall. We exclude the stripe and express the result as its distance from the clean background. We use the median instead of the average because light streaks can sometimes enter the lightbox.
This also improves test repeatability, since it allows for different cameras, lightboxes and backgrounds.
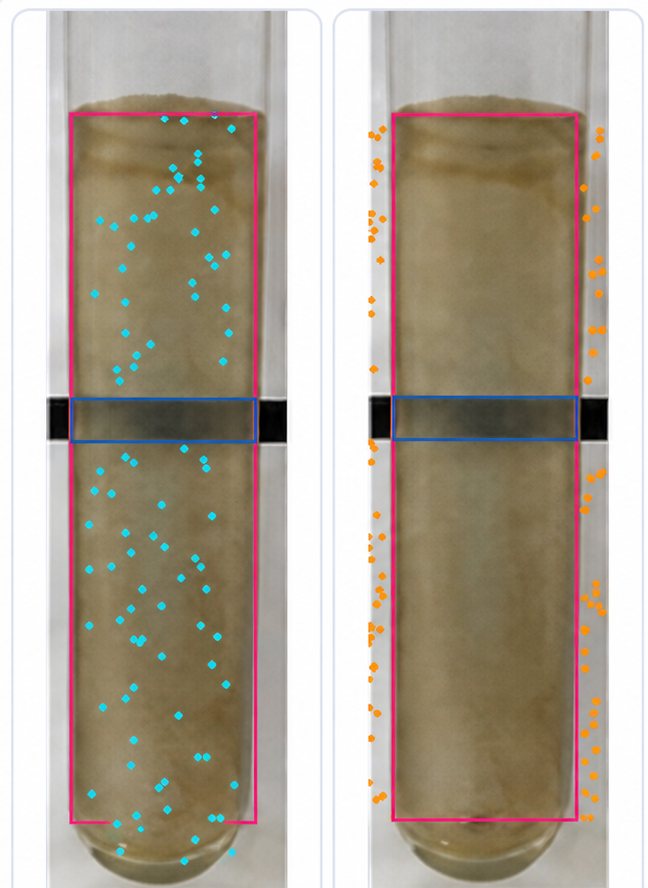
Figure 4: To score color, we take the median of 100 randomly selected pixels and compare it to the median color of the background.
The Opacity Score
Opacity measures how much the black stripe changes when you look at it through the glass instead of beside it. Both samples come from the same horizontal band, so they are directly comparable. Clear glass leaves the stripe looking much the same either way. A deposit film, however, hides it.
Next, the raw value goes through a fourth-power curve that strongly compresses the low end. As a result, normal optical variation in clean glass cannot produce a false positive. Only a film that truly obscures the stripe registers.
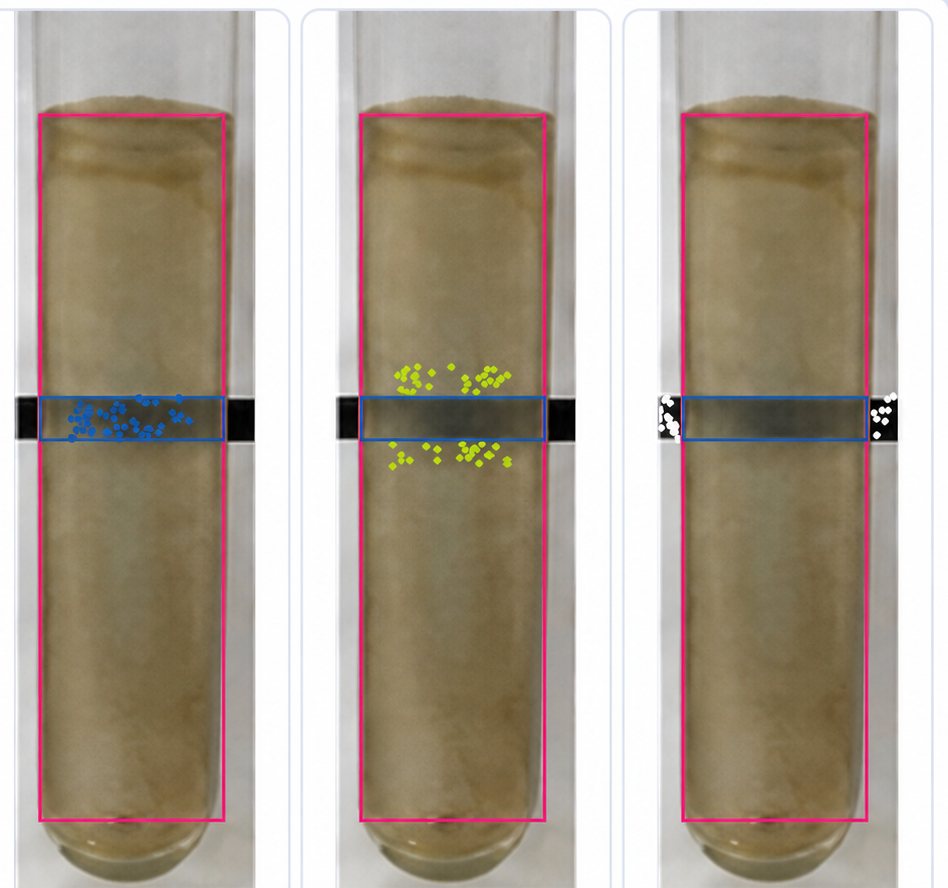
Figure 5: To score opacity, we measure the black stripe through the glass and compare it to the stripe just beside the glass.
Color vs. Opacity
When you compare the two, color is the leading indicator, as Figure 6 shows.
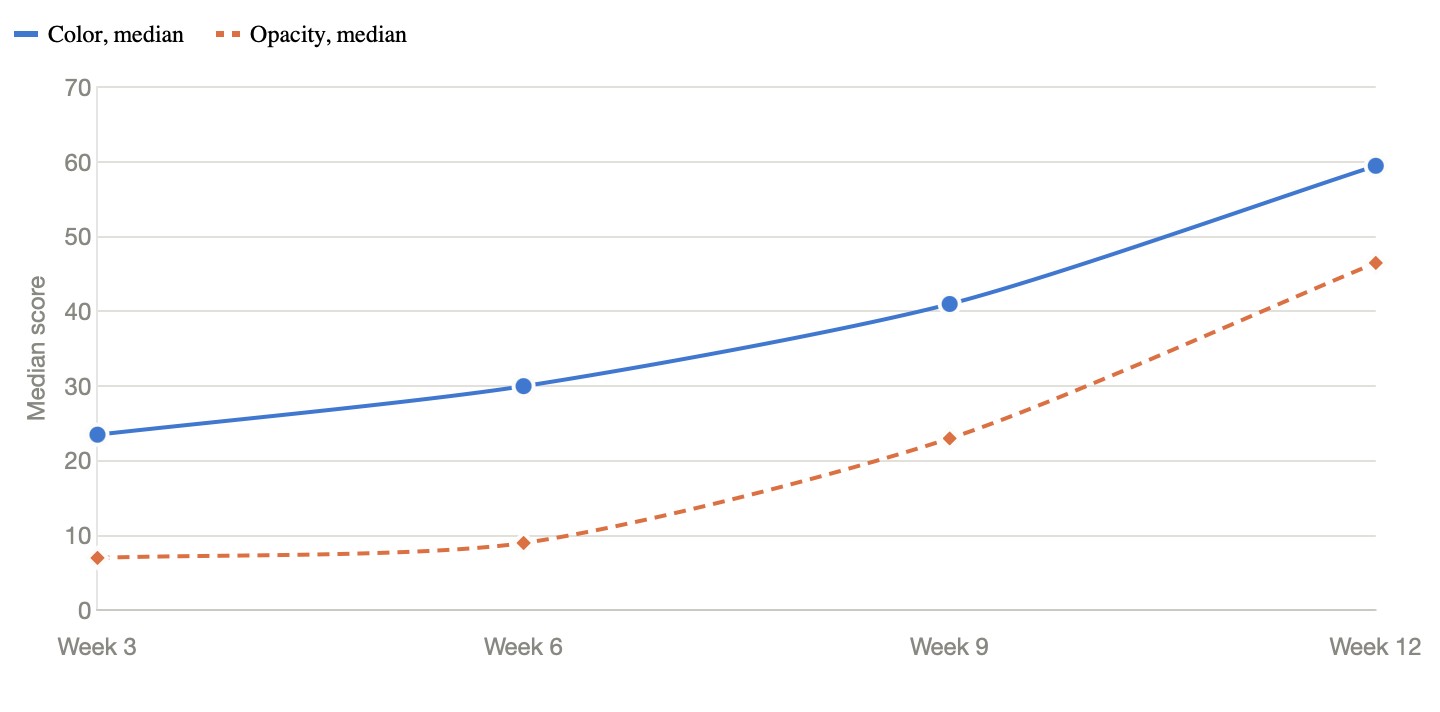
Figure 6: Across 52 TOPP tests, color is the leading indicator, followed by opacity.
However, some samples show strong color while keeping a good opacity rating. The reverse also happens, as Figure 7 shows.
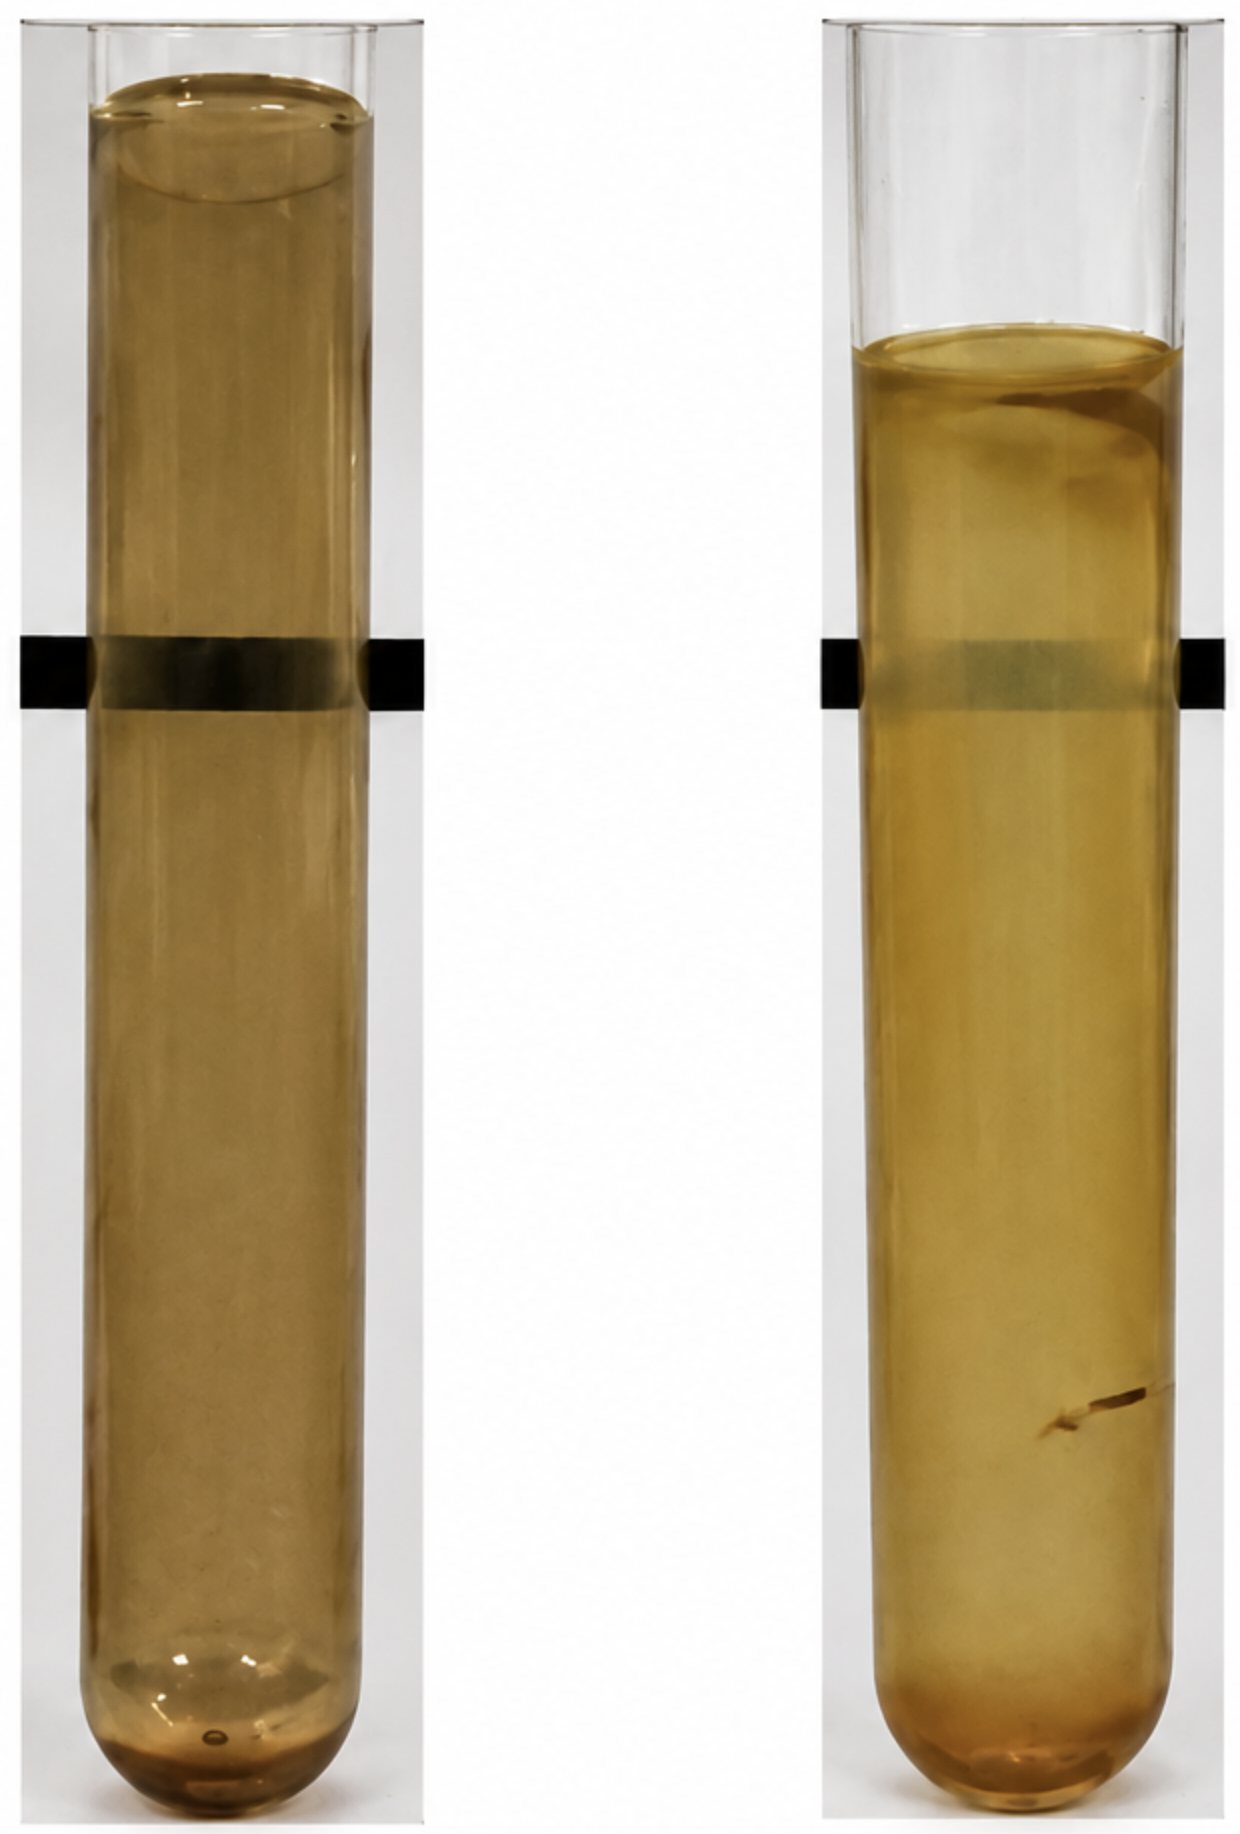
Figure 7: These two glass tubes have a similar color rating, but the first has much better opacity than the second. This suggests a deeper layer of deposits formed in the second tube.
For this reason, we report both color and opacity.
Together, they show how well an oil controls deposits in the TOPP test.
Conclusion
For most of the history of the TOPP program, the glassware was the most convincing evidence in the laboratory. Yet it was also the least useful. Everyone who looked at a glass tube agreed on what they saw, but nobody could put it in a report.
Color and opacity change that. Each score sits on a 0 to 100 scale and is normalized against the reference stripe in its own photograph. Together, these two numbers make the surface as trendable as the fluid.
You can set a vessel imaged in 2019 beside one imaged last week, in another laboratory, on another camera, and the comparison still holds.
Across 52 oils, the two scores behave differently, and both earn their place as glassware assessment values. Color moves first and gives the warning. Opacity moves later and confirms that a film has bound to the wall.
None of this replaces MPC.
MPC reports what the fluid is still carrying. The glass reports what the fluid has already given up. Deposit potential always had two dimensions. We can now measure both.
Related Reading
- Varnish: The Reliability Threat Hiding Between Samples (Part 1)
- Advanced Methods for Detecting and Measuring Soluble and Insoluble Varnish
- How Advanced Analysis Detects Varnish That Labs Overlook
- Why Turbine Oil Replacement Should Be Based on Condition, Not Time
- How to Select Turbine Oils Strategically for Improved Results Now