Condition-based greasing is an old and desirable idea. It is the finesse approach to fulfilling grease-based bearing care when done with precision. Efficient. Effective. Reliability-Enhancing. The most desirable objective for grease-lubricated bearings.
It can be systematically and utterly destructive when done improperly (without precision).
Whether this mode of grease replacement inherently enhances or kills your machine’s longevity is related to the practices developed and followed at your site.
In this article we’ll explore the following:
- A review of condition-based greasing
- Challenges with modern data collection prescriptions
- Data collection and quality issues
- Cost and efficiency challenges related to determining true condition-based intervals
- A recommended technique for fulfilling the promise of condition-based greasing
- The benefits of condition-based greasing
What is Condition-based Greasing?
Condition-based grease application is a grease replenishment practice triggered by increased bearing decibel values, the first hint of dry bearing surfaces.
Graphic 1 represents a snapshot of the interaction between a race and an element. The surfaces are separated by a thin film of oil, which could come from grease or oil in a reservoir. For grease-based applications, we expect the oil to either bleed from or volatilize from the thickener with time and shear stress.
As this occurs, the available oil reservoir dissipates, the oil film gets thinner, and eventually, the high spots on the races and elements begin to bump and rub. When this occurs, these contact points create sound waves that are well beyond the sensitivity of human ears. We refer to this commercially as ‘ultrasound.’
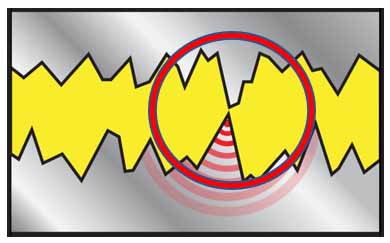
Graphic 1: The red circle identifies an Asperity as a .02 micron peak on the race surface. All surfaces have asperities.
Sharp points inside the red circle in Graphic 1 are called asperities. Machining and finishing form asperities on machine surfaces, including gear faces, cylinder faces, element bearings, and other parts. These asperities serve the purpose of preventing oil from being easily displaced from the load-contact point. However, it can cause problems if the oil film dissipates.
Ultrasound Detection for Condition-based Greasing
Ultrasound is created whenever asperities at machine surfaces collide. The sound waves emanate from the collisions in all directions.
The effect is similar to if you took a tuning fork designed to produce 35 kilohertz sound waves and pounded the tabletop vigorously. You would only hear the sound if you had a device that would convert the high-frequency sound waves into a frequency range acceptable for human perception.
To describe the wave created by contact energy, please consider Graphic 2, a steel ball dropped onto a steel plate. The moment of contact creates a compression wave that transmits at an exceptionally high speed through the solid plate.
This wave is measured and represented in decibels, a standard unit for measuring sound, as a measure of intensity. The sound waves are very short and occur at, and above 30-kilohertz frequencies, so we need help ‘hearing’ the contact event.
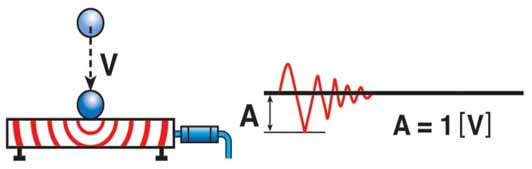
Graphic 2: Creation of a compression wave.
Graphic 3 represents what follows the initial contact. The weight of the ball causes displacement of the plate. The plate flexes up and down following displacement. The upward and downward movement of the plate can be depicted in a waveform that could be measured and reported in various engineering units—measurement of displacement energy central to what occurs during vibration analysis.
The upward and downward energy waves occur at a much lower speed than the waves passing through a solid steel surface. Each form wave energy can be accurately measured with the proper tools.
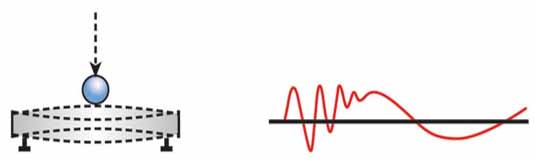
Graphic 3: Creation of a displacement wave.
Compression wave energy transmits very well through solid steel surfaces, so if we could find a way to accurately register that the moment of contact has occurred, then we could use the feedback to alter the risk of any further contact occurring by replacing the oil film intended to keep surfaces apart.
ALL lubrication practices aim to create conditions where that oil film is perpetually healthy, and the components can permanently float on the oil film.
If our underlying decisions are accurate, then, regardless of speed, load, and bearing surface area, we can make the machine parts’ float’ on a film of oil that is thinner than the width of a red blood cell.
Suppose we accurately calculate the oil thickness required for a machine surface to ‘float’ the load-bearing components operating at a given temperature, speed, and load. In that case, those asperities never or rarely have a chance to bump into one another.
The objective of the calculations is to identify precisely which lubricant is needed for the given surface area, surface speed, unit load, and operating temperature relative to the dimensions (height) of the asperities, how often it should be provided, and how much is required to keep surfaces apart.
If we have an accurate plan, we achieve a ‘Lambda’ value (aka specific film thickness) of one (1) or greater. Graphic 4 represents the factors for asperity dimensions (r) and oil film thickness (h).
When the oil film thickness (h) in microns is twice the asperity height (r), then we achieve a Lambda value of one (1), or one times the required oil film thickness. Graphic 1 (above) shows the result of having a Lambda of 1 or greater. Graphic 5 shows the result of a Lambda value of less than one.
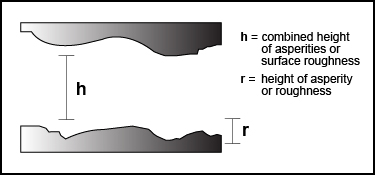
Graphic 4. Lubrication engineering calculations provide the means to calculate the required viscosity needed to separate surfaces for any set of operating conditions.
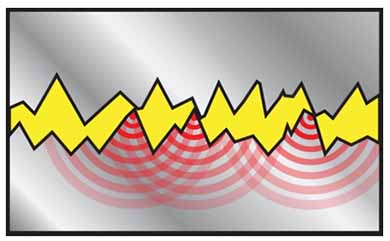
Graphic 5. Sound waves emanating from machine surfaces operating without adequate oil film
Any influence on the ‘steady state’ supply of the right lubricant, in the right volume and time interval, can cause the film to dissipate and produce the effect shown in Graphic 5.
Recognizing this undesirable state, we set about to replenish the lubricant through a ‘just right’ daily care and feeding plan to ensure that the correct volume is always present at the element, race, gear face, or any other interacting machine parts.
We love the notion of condition-based greasing because it promises us the means to hear when the surfaces are bumping and rubbing and provides just enough to stop this failure root cause before damage to the bearing can occur.
That is a very appealing prospect.
Conducting the calculations to make proper decisions, including the timing of grease replacement, is relatively easy, but someone must take the time to fulfill this need.
With this information as a backdrop, let’s consider what it takes to accurately measure this faint energy level when it begins to occur.
Data Collection and Data Quality Practical Challenges
As with oil analysis condition-based machine health measurement, sample collection quality is at the top of the list of Key Success Factors. There is potential for substantial signal intensity (attenuation) loss for various reasons. This condition monitoring technique will only fulfill expectations if the data collection method produces highly repeatable, high-quality signal recognition.
The two predominant challenges with compression wave collection are:
- Single attenuation through reflectance and refraction
- Quality of the sensor configuration in use
Both represent a potentially severe dissipation of signal strength during measurement. Let’s take a shallow look at each of these.
Signal Attenuation
Attenuation means the loss of signal strength as measured in decibels (dB). Low signal strength during readings can occur for a variety of common reasons, including:
- capability (sensitivity) of the sensor and instrument
- repeatability in the data collection process
- differences between the type of metal at the data collection point versus the signal generation point (aluminum zerk fittings against steel pipe nipple)
- very low shaft speed (<30 rpm)
- large bearing housing mass
- sensor positioning that causes reflection and refraction
While all of these are common, the last can produce a substantial damping impact on dB readings for a few good reasons.
With each mechanical interface, the sound waves reflect and refract, causing substantial losses to occur to signal strength.
If the sensor is placed around the top of the housing, such as on the zerk fitting at the top of the housing (the 12:00 position location for Graphic 4), as is a common recommendation for instrument providers) then the signal must pass across multiple interfaces, including those of dissimilar metals.
With each new interface (inner race to shaft at the 6:00 position, inner race to shaft at the 12:00 position, outer race to housing, housing to pipe nipple, pipe nipple to zerk, etc.), a part of the signal bounces back (reflection) and a part bounces off in another direction (refraction).
Aside from all the signal bending and bouncing, most asperity contact occurs at the center of the load zone where the oil is under maximum displacement pressure. For optimum signal detection, the sensor should be placed at the center of the load zone either axially (at the 5:00 to 7:00 positions under the shaft) or radially (perpendicular to the shaft on a plane equal to the lowest element position in rotation), or as close to the center as possible.
Poor signal placement forces the technician to make full-confidence judgment calls without clearly understanding surface conditions. In practical terms, the technician doesn’t hear asperity contacts because the signal is being ‘lost’ due to data collection methods.
Consequently, the technician only supplies grease once bearing distress is excessive. The technician inadequately lubricates the bearing by putting an insufficient amount of grease into the housing, appearing adequate due to the diminished signal.
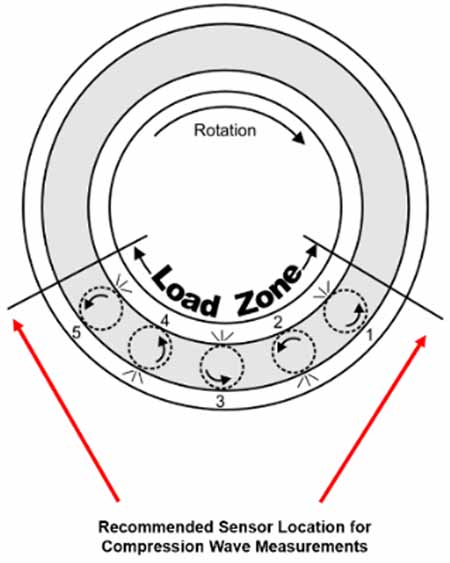
Graphic 6. The most critical part of ultrasonic energy measurement is the sensor’s location relative to the load zone.
Quality of the Sensor Configuration
There are two points of sensor configuration to consider.
The sensor’s sensitivity (can it detect a 35 kHz signal) and the mode of sensor placement wherever it may be placed.
Companies promoting compression wave detection are addressing the sensor frequency quality issues well enough to be satisfied that if all other conditions are met, the technology delivers on the promise of advanced oil film health measurement.
The second aspect of Sensor Configuration involves the precise method of attaching the sensor to the machine. As demonstrated by Graphic 7, the nature of the contact mode is essential for maximum dB detection at high-frequency ranges. Options one, two, and three are popular modes for placing sensors on surfaces because they are straightforward, but they are not very helpful.
Options four, five, and six require management and technicians to put substantial effort into sensor placement to avoid any energy leakage.
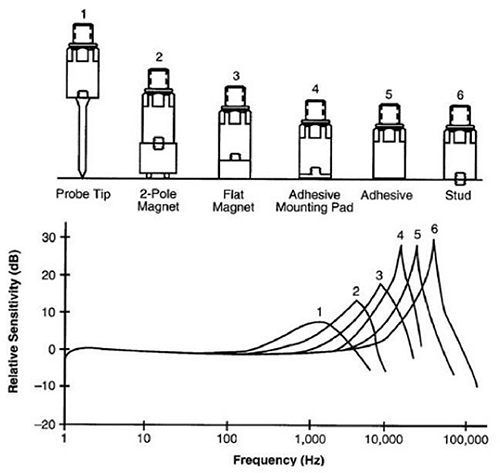
Graphic 7. Data collection modes, relative sensitivity at high frequencies.
The most promoted approach employs stinger probes or 2-pole and flat magnets due to their relative ease of use and low setup cost (no gluing or drill/tap/thread work). However, coupled with the Signal Attenuation issues already discussed, a poor sample collection technique can compromise the detection of whatever signal might be present.
Proper technique is most crucial at frequencies above 10 kilohertz. As noted previously, compression waves travel at 30 kilohertz.
Per Wilcoxon Corporation, the ‘best practice’ for high-frequency energy capture is to use adhesive with mounting pads (lower cost approach), adhesive with permanently mounted sensors, or a stud-mounted sensor.
If options such as 4, 5, or 6 are not possible, management should abandon the notion of strictly condition-based greasing. If the asset carries a top criticality level, then this upgrade is well worth the relatively low cost of the effort.
Challenges Associated with ‘True’ Condition-Based Greasing Practices: Timing of the Visits
There are three choices for setting the visit schedule to measure for a dB change that signals a need to replenish. To be clear, success with this technique means catching the ‘dry bearing’ conditions at the earliest possible stage and supplying just the quantity needed to re-float the surfaces.
The options are as follows:
- True Condition-Based Approach – Measure every bearing daily until you have an interval.
- False Condition-Based Approach – Pick an interval and incrementally adjust from there.
- Calculate the ‘best fit’ interval and refine it to a condition-based approach by making adjustments until the best fit is determined.
Let’s look at the cost and duration to perform each of these as applied to electric motor lubrication practices. Instrument providers often prioritize this as a sales focus due to the challenging nature of proper motor lubrication.
For the sake of an apples-to-apples comparison between these three modes, let’s assume that the bearing manufacturer has told us that each motor requires replenishment at 244 days based on the conditions noted in Graphic 8.
At first glance, this is counter-intuitive because we are accustomed to lubricating motors on 6- and 12-month cycles. After all, that’s just what we’ve always done!
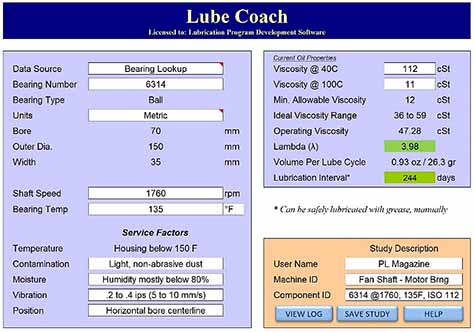
Graphic 8. Use of DIN 51825 (modified) to determine the frequency for given operating conditions.
Assume the following:
- There are 100 critical 75 HP motors, and you have configured measurement for the most technically viable data collection options.
- We believe (from the calculation) that the best frequency is 128 days.
- Each ‘visit’ to the motor bear will take 5 minutes.
- The labor rate is $60.00 per hour, making each visit worth $5.00 in cost.
Scenario 1: Measure every day (the ‘True’ approach).
Cost:
- 244 * 5 minutes * $1.00 per minute = $1,200 per motor.
- $1,200 per motor * 100 motors = $120,000
Work hours required:
- 244 * 5 minutes each = 1,220 minutes per bearing.
- 1,220 minutes / 60 minutes per hour = 20.33 hours per motor.
- 33 hours * 100 motors = 2,033 expended work hours for the 100 motors
Scenario 1 requires a full work year from the technical trades to fulfill the promise of condition-based lubrication for only 100 hours.
Scenario 2: Use a repeating pattern to reduce cost and shorten the determining cycle
Measure bearings starting from some repeating pattern, and make adjustments until the ‘best fit’ is determined.
A repeating pattern could be anything you like. Since we have a ‘village lore’ based history of lubricating motors on month-increments (6 months, 12 months, etc..), we could start with what is already in place.
We will lubricate and adjust (extend) the interval with each interval until we identify the dry bearing condition. Knowing we’ve gone too far, we’ll take a fraction of the last adjustment and shorten the interval. For instance:
Lubricate the bearing, and then check six months later (condition-based lube check – visit 1). We find no grease is needed in our apples-to-apples comparison of the 244-day expectation. Lubricate again, and check in 12 months.
Visit 2: At 12 months (now 18 months into the investigation), we see that the interval is too long, so we lubricate again, deduct one-half of the LAST interval adjustment (6 months is shortened to a three-month adjustment to (12 – 3 = ) a new interval of 9 months.
Visit 3: We return at nine months and see that the bearing is dry again. (now 27 months into the investigation). We relubricate, cut the last ‘adjustment’ by half, and reset the new interval to (9 months less 1.5 months = ) 7.5 months, or 225 days.
Visit 4: We return at 225 days (now 25.5 months in) and see that the bearing does not yet need lubrication. We EXTEND the interval by ½ of the last adjustment (7.5 months plus 3/4 of a month = ) 8.25 months, and we find that the dB value has risen slightly, and it is time to lubricate based on condition.
In sum, using this method, it has taken 33.75 months to ‘find’ the suitable interval based on condition, and we have made four visits and expended ($5.00 per visit * 4 visits = ) $20.00 in labor for the motor. For 100 motors, we have spent (5 minutes per minute at $1.00 per minute * 100 motors = ) $2000.00 and taken three years (rounded) to make decisions about the 100 critical motors. Certainly a better outcome, but we didn’t take the purist approach with a strictly condition-based estimate.
Scenario 3: Calculate a ‘near ideal’ interval, and shorten the correction cycle.
This approach, like scenario 2, is NOT a true condition-based plan. Like scenario 2, we will pick a starting point and adjust as needed by small increments to extend or shorten the cycle to find the ‘best fit’ interval.
Unlike scenario 2, this approach will begin with standardized engineering practices. The LubeCoach software in Graphic 8, is based on DIN Standard 51825 (with slight modification for practitioner use) to calculate the interval best fit based on the bearing in its actual operating conditions.
The DIN standard was pioneered through the effort of a working committee of bearing manufacturers in the mid-1980s and is considered the best option available to make this type of determination.
The original DIN standard incorporates measures for the C/P Load factor (static to dynamic loading ratio – something we are not privy to with a machine that has been in operation for years) and ALSO a grease life factor (F10, hours, a value known by lubricant manufacturers, but is NOT published) as well. If you’d like to learn more about the variations, see these articles (PDF) on Optimizing Lubrication Effectiveness Part 1 and Part 2.
Scenario 3 requires that the reliability engineer goes to the motor, records the shaft speed, bearing numbers, shaft orientation (horizontal or vertical), temperature, moisture load, particulate load, and vibration level, and plugs values to the appropriate locations in the calculator. The output, as shown in Graphic 8, provides a specific interval for service, as follows:
Visit 1: @ 244 days, measure dB value for replenishment requirement. If the bearing is dry, replenish and reduce the interval by 10%. If the dB values are still low (oil film is good), extend the interval by 10%.
Visit 2: At either 220 or 268 days, measure the dB value for the replenishment requirement and make another incremental adjustment based on 50% of the last adjustment value.
Visit 3: (now between 464 and 512 days in) Repeat step 2 and adjust similarly as needed. Experience suggests that two adjustments will enable the technician to achieve the desired ‘condition based’ regrease interval.
With this method, the site is in search mode for between 48 and 42 months and has an expenditure for field checks at $15.00 per bearing and $1,500 for the proposed lot of 100 motors.
Extrapolating Condition-Based Regrease Practices to the Entire Bearing Population
Even a small production site (150 to 200 assets) will have a large population of oil and grease-lubricated bearings operating at different speeds, loads, temperatures, and operating environments. The oil-lubricated bearing maintenance is simple: make sure the oil in the machine is the right type and at the right level.
The grease-lubricated bearings will create a morass of complicated scheduling and schedule monitoring based on the intervals that could be scattered between weekly to multiples of years based on the sizes, speeds, and other operating conditions.
It is possible to produce, execute, adjust, and eventually finalize a proper condition-based interval.
However, that doesn’t mean it is cost-effective or operationally efficient to do so. If/when the exercise from start to finish is measured in years and requires years of technicians’ time, and costs well above six figures even for a small production site, then true condition-based intervals (scenario 1) selection is not feasible.
Scenarios 2 and 3, which eventually identify the condition-based interval, are much more cost and time efficient, with scenario 3 producing the most efficiency.
Benefits of Condition-Based Greasing Practices
The core benefit of condition-based machine care of any sort is the opportunity to keep the asset operating in a productive state. Bearing replacements are disruptive and costly before you factor in the cost of lost production time. Lost production time triggers the worst negative consequence of parts replacement – the risk of losing customers due to missed shipments.
Condition-based, or modified condition based, regrease activities should be directed toward the most critical assets. Assuring that the proper lubricant is applied in the appropriate volume and at the right time is the first line of defense against machine repairs.
Refining condition-based greasing with a well-defined starting point enable the technicians to determine the optimum state without wasting time and money.