With all that maintenance personnel must do daily in their industrial, manufacturing, and mining environments, why should management task their engineering resources to invest time, energy, and money into a ‘Precision Lubrication’ work plan?
Because the industrial world floats on an oil film that is less than the thickness of a red blood cell, and if we don’t protect that film – we lose.
Daily lubrication care and feeding of machines is a reliability cornerstone.
If it can be done with utterly precise definition and deployment, mechanical machine repair work will decline. Precision Lubrication work practices will impact the pace and intensity of the industrial/manufacturing environment for the better.
The Indirect Impact: The most prominent reason to focus on improvements in this foundational plant practice is to improve plant capacity. MRO reductions may inspire the initiative; however, regardless of the size of any MRO savings, this value pales in comparison to the value accrued to the organization through dependable, repeatable capacity.
Dependable, repeatable capacity enables progress in multiple underlying aspects of enterprise management: reduced COGS, improved or sustained quality, improved safety performance, improved customer satisfaction, improved financial performance, improved value for stockholders, and improved job security for the persons involved in the enterprise.
The Direct Impact: Precision Machine lubrication also enhances the direct financial performance of the maintenance practice. Consider this: for every dollar spent on lubricant purchases, a capital-intensive manufacturing plant will also pay between $10 and 20 dollars on repairs of lubricated and their tangent components. The site will also spend $3-5 on labor for each dollar in lubricant purchases.
Analyze your budget, and you will find this relationship to exist.
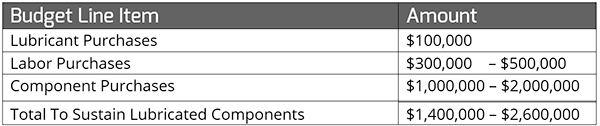
To put this in another context, for each dollar the site spends on lubricants, it will spend, on average, another $20 to sustain the operation of lubricated components.
Two changes must occur to reduce MRO expenses, particularly those costs relating to machine repair.
- First, create a work plan that assures that the thin layer of oil can be sustained.
- Second, make the oil film between the components cleaner.
That’s it. Accomplish these two changes, and the MRO expense will decline. Theoretically, it must decrease. Accomplishing these two changes is not easy, but it is certainly possible and is highly lucrative for the machine owner.
The Benefit of Wider, Cleaner Dynamic Oil Film Clearances
The impact of improvements in the selection, application, and maintenance of the lubricant to accomplish the two results (thicker, cleaner) can be immediately recognized through reduced costs in lubricant use, labor use, and parts replacement.
Each lubrication program assessment (Benchmark/Gap Analysis) to date has uncovered overwhelming cash flow and five–year return potential when the following program parameters are analyzed:
- Product consolidation and inventory reduction
- Product (lubricant) lifecycle extensions
- Product cleanliness management
- Lubricant application and replenishment rates
- Sampling and Analysis improvements – sample collection
- Sampling and Analysis improvements – test selection and alarm setting development
- Component rebuild reductions
The most significant financial impact, limiting production losses, is generally not included for various reasons.
The Economic Driver – Reduced Cost of Operations
Because it is a ‘maintenance’ function, and maintenance is generally responsible for managing the cost of existing capacity rather than expanding capacity at a reduced unit cost, the likely driver will be reduced ongoing cost of machine care.
Fortunately, the long-term improvement in cash flow from combined reductions in labor consumption, material consumption, machine parts consumption (machine repair), and lost production (due to scheduled and unscheduled downtime) represents a tremendous dividend for an arguably minuscule investment.
Building Precision Lubrication
Creating a precision lubrication work plan is not complex. Calculus is complex. This isn’t like doing calculus. However, it is complicated due to the many variables that must be considered when building precision lubrication work plans.
AMRRI follows a systematic plan refined through 35 years of lubrication work plan development. This plan can be replicated by company personnel at the production site if they are willing to put in the effort.
The steps are as follows:
- Create a floor plan that shows the location of all rotating assets.
- Using the drawing, define an efficient and linear path between one machine to the next in the production area. Working with management and technicians, define the machine care sequence that represents the fewest possible steps from one machine to the next. This becomes the sequence for the operator-based care and/or the lubrication route.
- Following this path/sequence, collect information about each lubricated component on each machine.
- Log the machines and their respective components into a task management system.
- Log the discreet component lubrication activities into the task management system.
- Generate weekly machine care routines based on production area routes.
- Track the completion (or lack of completion) of each task.
- Generate performance reports based on what is getting done
I’ll elaborate on each of these actions below. Suppose the reliability or maintenance engineer is given the time to follow each of the steps noted below. In that case, that engineer can build and deploy a daily care plan that can completely change the nature of maintenance in their facility. Let’s get started.
Step A: Creating a Floor Plan (aka Mapping)
The only constant that we can count on is change. Change in the workforce has become a relentless challenge for industrial/manufacturing production and maintenance management. This seems especially true for this particular role in the maintenance department. As new persons enter this role, regardless of whether they are an old-timer or newcomers, they should have access to a plan that shows the most efficient way to do the job. Defining that efficient plan begins with a high-level view of the production floor.
To accomplish this, we use Excel to create a plot and populate that plot with tanks, stairwells, elevators, and of course, ALL of the operating machines. As shown in the drawing below (Diagram 1), creating the structure to produce a floor plan rapidly is very simple in Excel.
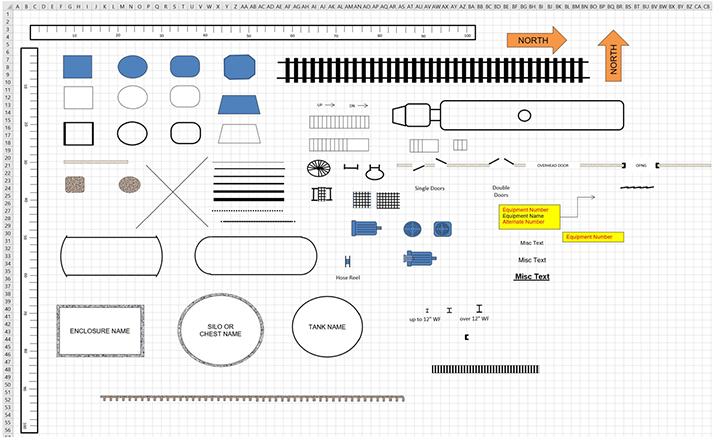
Diagram 1. Floor Plan Mapping
A simple grid pattern with a scale for horizontal and vertical orientation, along with simple graphics representing common elements, can be quickly generated and replicated as needed.
Once the essential elements are available, the engineer will walk down the operating cell, making notes about the location and distance between relevant interests, and then transfer those notes to the excel worksheet.
Step B: Route Design
Once machines are plotted, it is possible to see an efficient pathway through the machines. Diagram 2 represents a floor plan with a suggested route pathway. It is best to have maintenance and technician involved in plotting the route pathway so that the route reflects technician interests.
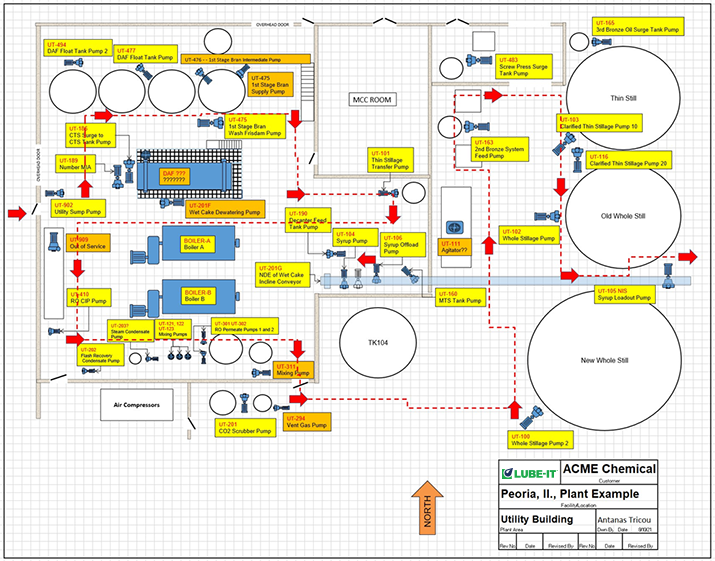
Diagram 2. Lubrication Route Design
Step C: Collection of component-specific machine information.
After defining the route sequence, the persons collecting machine data return to the machines in the order established by the route sequence and locate every moving component in the drive train. Some of these may not require lubrication but should be included to prescribe some level of inspection of those machine parts if possible.
Once the components are identified and categorized, the program builder will apply the well-established engineering principles available for the respective lubricated machine parts to define the parameters of the lubrication work plan.
For example, element bearings are defined through the following six steps and calculations.
Step 1
Determine if the bearing in its current operating state is suitable for grease or requires oil. The bearing manufacturers suggest calculating the nDm value and comparing that value to the speed limit factors for the bearing. If nDm is lower than the limiting factor, then grease-based care should be acceptable to deliver long life cycles. If nDm is above grease’s limiting factor, then oil should be used.
Step 2
Calculate the nDm. It is shaft speed multiplied by the median diameter ((ID + OD) / 2). Bearings have different speed limits based on bearing type and design for axial loading. Diagram 3 represents generally accepted parameters for oil and grease speed limits.
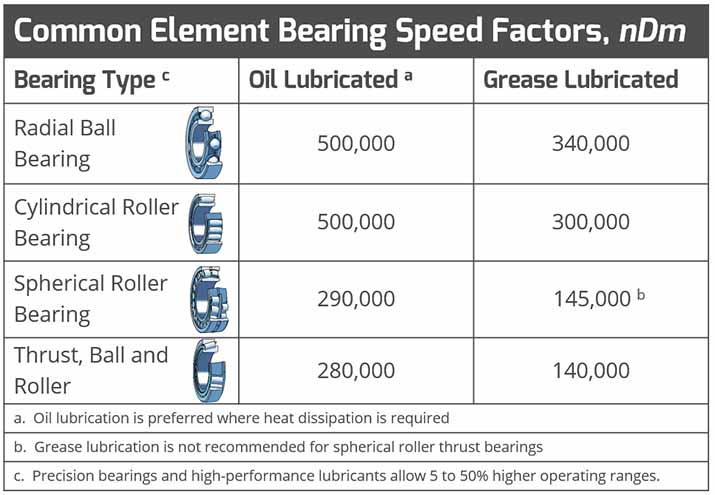
Diagram 3. Generally Accepted Parameters for Oil and Grease Speed Limits
Step 3
Determine the minimum allowable viscosity requirement for the bearing. The formula provided for this is:

Dm = bearing median diameter, and was previously noted. RPM is shaft rotating speed in revolutions per minute. This formula is designed for double-roll spherical rolling bearings. Still, it is suitable for determining requirements for other bearing types, leaving just slightly higher viscosity requirements per bearing type than the actual formulas designated for ball, needle, and roller-type bearings.
Once we know the minimum viscosity limit, we can calculate the actual viscosity provided by the selected lubricant or plot that value on a chart.
Step 4
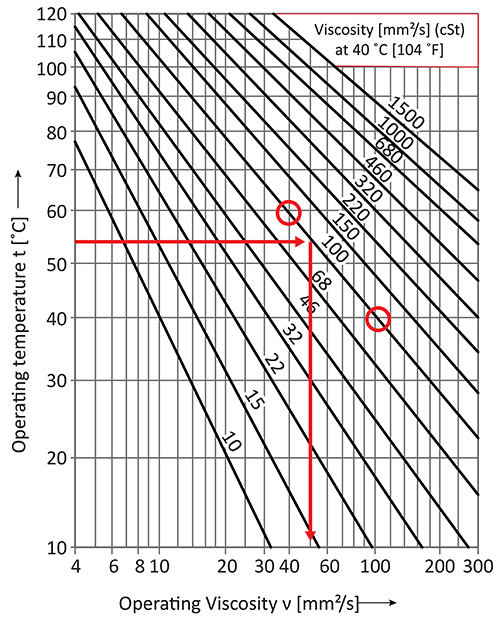
Determine the viscosity at the component’s operating temperature. Diagram 4 represents the viscosity changes with temperature for several VI 95 mineral oils. The program builder provides an operating temperature for the bearing and plots that temperature against the viscosity of the lubricant in use (regardless of oil or grease-based replenishment) to determine what the operating viscosity actually is and, therefore whether that lubricant is an acceptable selection. In the example, the operating temperature is 55°C, and the grease is manufactured using ISO 100 (100 cSt) mineral oil. Accordingly, the operating viscosity is 50 cSt.
As long as the operating viscosity is above the calculated minimum, preferably between three and five times above the minimum, the lubricant selection is a good choice. Outside of that range, it is worth examining more closely.
Step 5
Determine the proper volume per replenishment cycle. This does not apply to oil-lubricated machines since our objective with those is to maintain an identified oil level. Still, it is essential for grease-based machine care that we avoid overfilling the bearing cavity with each replenishment cycle.
Two formulas could be used for this, as proposed by either SKF or FAG bearing companies. The output for either is very similar, but the required information is much easier with the SKF formula, so we’ll look at this option.
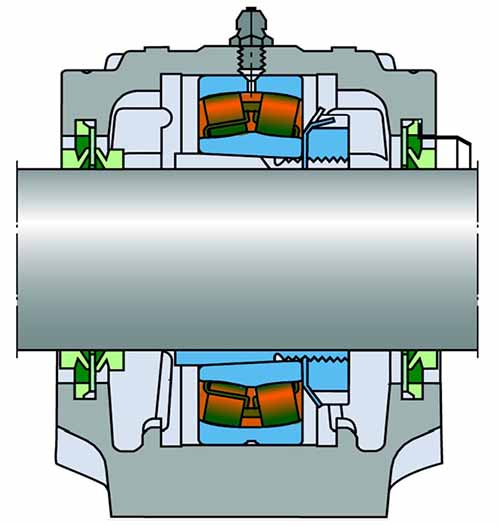
Per SKF, the bearing width multiplied by the axial width of the bearing multiplied by the imperial or metric constant value gives us the quantity of grease that the bearing cavity (space around the elements and between the rings) can hold. Once that quantity is delivered, additional grease can be problematic. This is situational, related to the nature of the sealing method and the rotating speed. Sometimes flushing profusely is the best call, but typically it is best to calculate the capacity and stop with that volume.
The SKF bearing area highlighted in orange in Diagram 5 represents the area that should be filled with the calculated quantity. If the bearing is lubricated while in service, the elements will press the grease to the sides as it is being supplied, the elements and races will be ‘washed’ with fresh grease, and a reservoir will pile up adjacent to the sides at the bottom of the race.
Step 6
The final step is determining how often the specified quantity should be applied. This step is a bit more mathematical but is easily accomplished using excel. Formula 2 below identifies a calculation that closely matches frequencies provided by DIN 51825 but without the problems associated with determining the static-to-dynamic load ratio (a machine design decision) OR the F10 grease lifecycle value (a lubricant manufacturer value that is rarely published for public use).
Formula 2, as used by AMRRI, is as follows:

Where:
d = bearing bore in millimeters
n = shaft speed, revolutions per minute
K = product of the selected discount factors for the operating conditions
Diagram 6 reviews the six operating conditions that should be reviewed and used as appropriate.
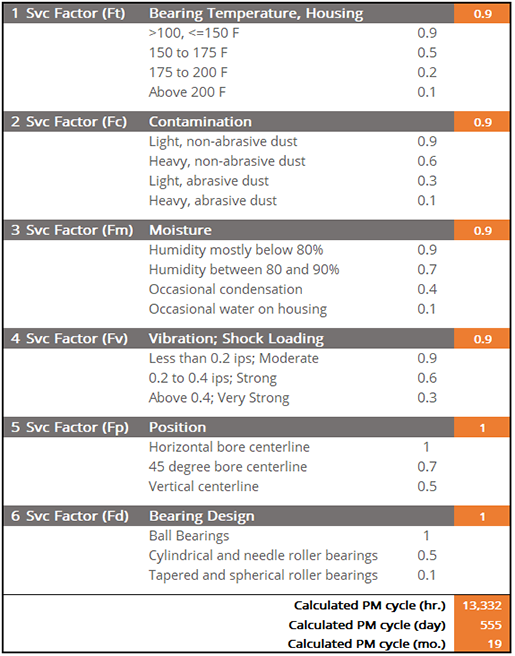
Diagram 6. Machine Operating Conditions
Once these values are all collected and calculations made, the program builder has an objectively planned, quantitatively defined lubrication service plan for the bearings.
For low-speed bearings, since shaft RPM (denominator factor) so substantially influences the net interval, it is possible to see long service intervals. To avoid excessively long intervals, once the value is determined, it should be pro-rated (along with grease volume) for some value at one year or less to ensure there are ‘eyes on’ the components at least once a year.
There are different but equally essential engineering principles (formulas) for gears, couplings, journal bearings, hydraulic elements, and other lubricated machine components that will not be addressed in this brief article. These principles and formulas are all in the public domain and can be found by searching vendor websites and periodicals.
The net effect of applying standardized engineering principles to the component reviews is the development of technically accurate, efficient, and practical work plans for each component.
Diagram 7 provides a limited example of what the output would look like for just a few assets.
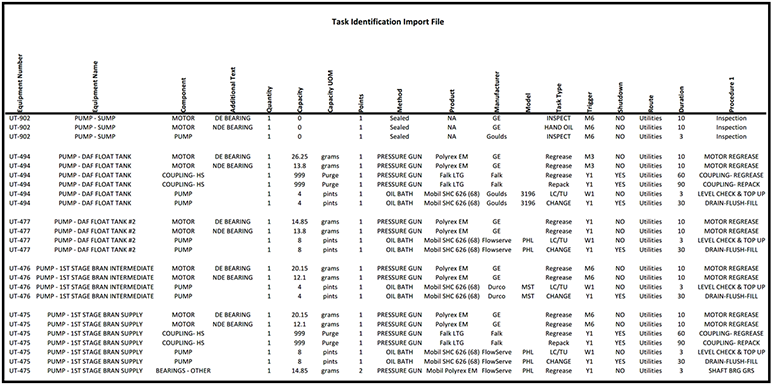
Diagrams 7
Steps D and E: Deployment of machines and tasks into a Task Management Software
Having all the details organized in this manner for all tasks that support asset rotation makes it easy to populate machines, and their respective tasks, into a management system. CMMS programs traditionally do NOT provide data fields needed to house information related to sub-sub-sub machine elements.
Accordingly, while it may be a magnificent system for many other things, SAP (and other enterprise systems) is an inefficient tool to track tasks that should be scheduled and managed at the sub-sub-sub asset level.
Task management software is designed with extra levels of hierarchal structure to accommodate work planning at the level where the work is to be done. Further, task management systems can be used for many tasks beyond lubrication-related activities (fire extinguisher checks, safety system/equipment checks, food production safety documentation, etc.).
For machine lubrication purposes, scheduling and tracking each lubrication task in mass, by route, and then reporting completion records is an excellent benefit to site management.
Once populated and organized in the linear sequence, the system sets up for operation by route structure and sequence similar to what we see in the green box within Diagram 8. Each task has a permanently assigned sequence number.
A properly engineered program will have tasks that will occur at many different intervals, as seen in the red box in Diagram 8. In this small example, based on the stated intervals, it is evident that things will appear in the weekly schedule periodically, with very few tasks appearing each week that the schedule is generated.
However, whatever tasks are generated with the weekly schedule will all be organized in the same familiar sequence.
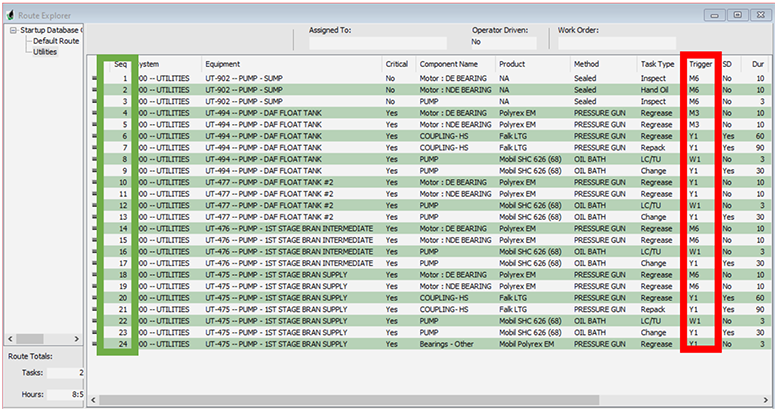
Diagram 8
Diagram 9 shows what a typical work distribution would look like. The sequence numbers create the order of output in the route, regardless of which of the 24 task items shows up with each work period.
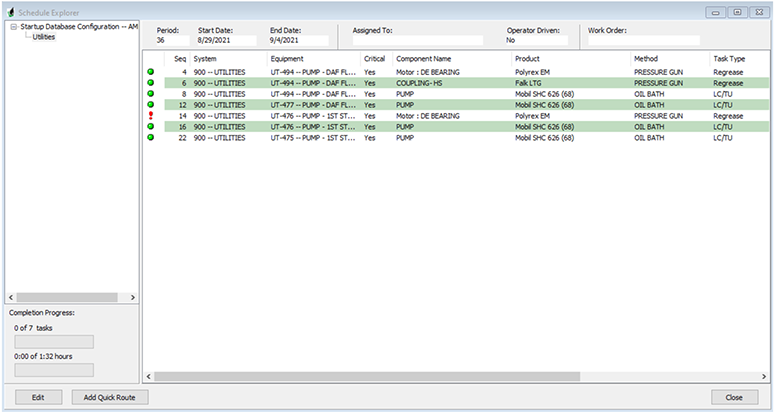
Diagram 9
Since each task is independently defined, each task is independently trackable. And, since pre-organized groups schedule each task, management can schedule thousands of tasks with a few keystrokes in a matter of minutes.
With site lubrication details organized this way, and with each detail represented as a data field (rather than a text script), management will have the means to generate reports on any of the data fields used to build the plan, including work completion percentage, tasks skipped, completion dates for tasks, lubricants consumed, where lubricants of a specific type are used, etc.
The examples used in this paper are from LUBE-IT, the world’s most widely used lubrication management software. It is equipped with 60+ standardized reports and the means to make custom reports based on each customer’s KPI preferences.
The industrial world floats on an oil film that is less than the thickness of a red blood cell. We have to get this right.
Lubricant purchases represent one to three percent of the maintenance budget. Labor for machine lubrication is another three to five percent, including salaries and wages. The expense is a rounding error to the annual operations budget but impacts 35% of an industrial maintenance budget.
Suppose precision is applied to this element of industrial maintenance—the potential to improve productivity and reduce cost by avoiding machine repairs. Building a precise lubrication practice requires the application of well-established engineering principles. It can be completed by personnel at the site if they focus and are given time to fulfill the steps.
A well-executed Precision Lubrication work plan is foundational to turning a money-losing operation into a very competitive and financially healthy organization.