In industrial maintenance and reliability engineering, few concepts are as intuitively powerful as the Pareto Principle—also known as the 80/20 rule. Originating from Vilfredo Pareto’s observations of wealth distribution, this principle has evolved into a universal heuristic for identifying and prioritizing key contributors to outcomes in various systems.
When applied to oil analysis and lubrication in industrial sites, the Pareto Principle becomes a strategic lens for uncovering the few root causes that contribute to the majority of lubrication-related failures, inefficiencies, or costs.
This article explores how the 80/20 rule can be harnessed to improve lubrication practices, interpret oil analysis data more effectively, and drive proactive maintenance programs that prevent catastrophic failures and optimize equipment uptime.
Understanding the Pareto Principle in Maintenance Context
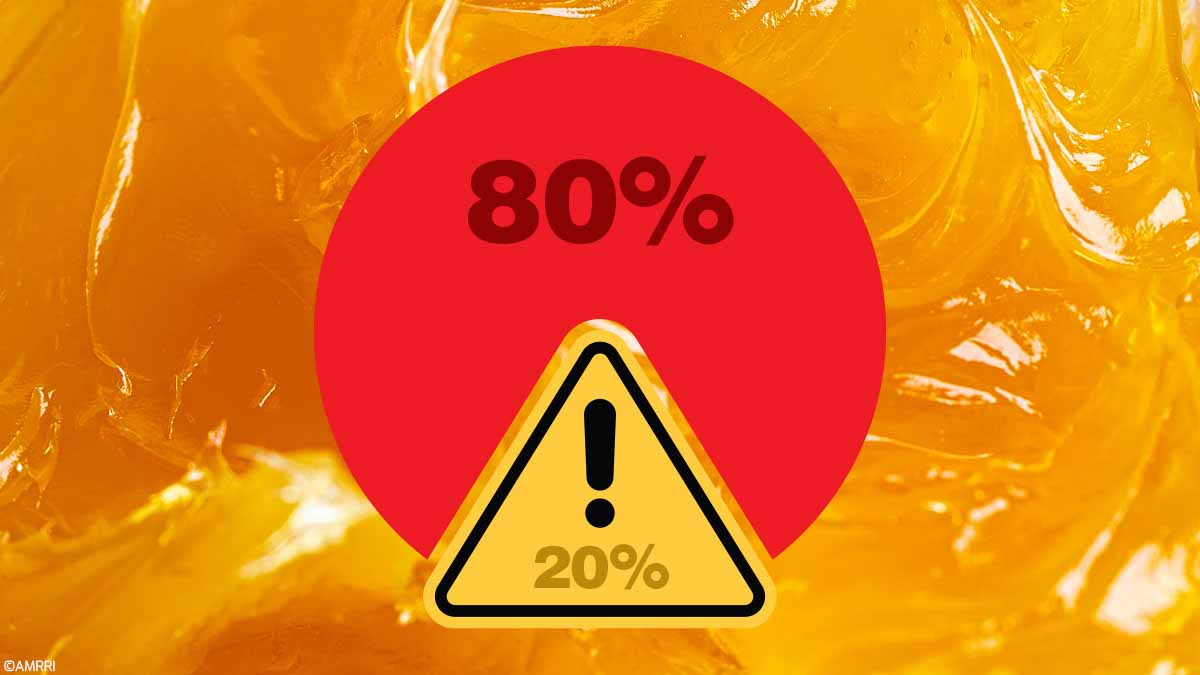
The Pareto Principle suggests that 80% of the consequences come from 20% of causes. In maintenance, this often manifests as:
- 80% of downtime comes from 20% of the assets.
- 80% of failures arise from 20% of the failure modes.
- 80% of lubrication problems stem from 20% of systemic causes.
It’s not always a perfect 80/20 split—it might be 70/30, 90/10—but the essence remains: a minority of inputs drive most results.
The Relevance of Pareto in Lubrication and Oil Analysis
In lubrication management, problems such as excessive wear, contamination, oxidation, or varnish are typically not evenly distributed across all assets. Often, a handful of machines or poor practices are responsible for most lubrication issues.
By applying Pareto thinking to oil analysis reports and failure data, organizations can identify:
- Which machines cause the most oil-related problems.
- Which contaminants or degradation modes (e.g., water, particles, oxidation) are most responsible for wear.
- Which human errors or process gaps (e.g., over-greasing, delayed oil changes) create recurring lubrication issues.
Common Lubrication Problems on Industrial Sites
Before diving into Pareto-based solutions, let’s categorize common lubrication problems observed in industrial environments:
Contamination
- Particulate contamination (dust, wear particles)
- Water contamination (condensation, seal failures)
- Cross-contamination (mixing incompatible lubricants)
Degradation
- Oxidation due to thermal stress or long drain intervals
- Thermal degradation due to temperature
- Varnish formation in turbine and hydraulic systems
- Additive depletion in modern synthetic oils
Human and Procedural Errors
- Improper lubricant selection
- Over or underlubrication
- Lack of lubrication schedules or documentation
- Incorrect oil sampling methods, leading to misleading analysis
Equipment Design or Condition
- Poor seals or breathers
- Inaccessible lubrication points
- Aging machinery with high internal clearances or hotspots
These problems create a web of interlinked failure causes—but applying a Pareto analysis can clarify which issues deserve immediate, focused attention.
Applying Pareto Analysis to Oil Analysis Data
Oil analysis laboratories and CMMS (Computerized Maintenance Management Systems) often collect thousands of data points. The challenge is prioritizing corrective actions based on this overwhelming data. Here’s how the Pareto Principle helps.
Step 1: Aggregate the Data
Collect a year’s worth of oil analysis reports across all critical assets. For each sample, extract flagged issues, such as:
- Particle Count > ISO 18/16/13
- Water Content > 500 ppm
- TAN > 2.0
- Wear Metals above alarm thresholds
Step 2: Categorize Failures
Group issues into categories:
- Wear (Iron, Lead, Copper)
- Contamination (Water, Dirt)
- Degradation (Oxidation, Nitration)
- Additive Depletion (ZDDP, Ca/Mg levels)
Step 3: Quantify Occurrence
Tally how many times each issue occurred. You may find, for example:
- % of reports show particle contamination
- % shows elevated wear metals
- % shows high oxidation
- % shows water ingress
Step 4: Visualize with a Pareto Chart or Table
Create a bar chart from most frequent to least frequent issue, with a cumulative percentage line.
This visualization immediately shows you that 80% of your oil analysis alerts may stem from just 2 or 3 primary causes.
Step 5: Target the 20%
Now focus efforts on reducing these top causes by investigating:
- Source of contamination (Are breathers effective? Is filtration adequate?)
- Lubrication schedules (Are intervals too long?)
- Training gaps (Do technicians know how to sample or top off correctly?)
Real-World Example – Pareto in Action
Steel Manufacturing Plant, Case Study
At a steel plant running 250 hydraulic systems, the maintenance team struggled with chronic equipment downtime linked to hydraulic fluid failures. They implemented a two-year oil analysis program and categorized around 1000 samples, 2 samples per asset per year.
One of the first problems the site must address is the report from the lubricant analysis service provider. The report does not identify the type of failure the oil is suffering from; simply, like most providers, they flag a value that is above normal or outside the limits and mention said value in the report.
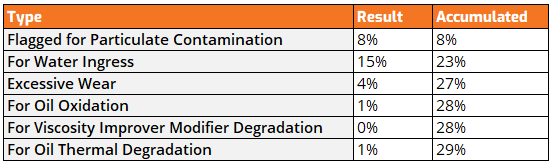
Thus, all the results from the nearly 1,000 samples had to be uploaded to an expert system we designed together with the support of state-of-the-art data analysis tools. After data processing and correct application of the fundamentals of oil analysis, the results were as follows:
- 38% flagged for particulate contamination
- 24% for water ingress
- 9% for oil oxidation
- 7% for oil thermal degradation
- 8% for viscosity improver modifier degradation
- 14% excessive wear
Many of the samples shared at least two of the identified conditions, in some cases due to the creation of a vicious cycle between them. For example, the presence of water generates wear, and wear can generate more wear.
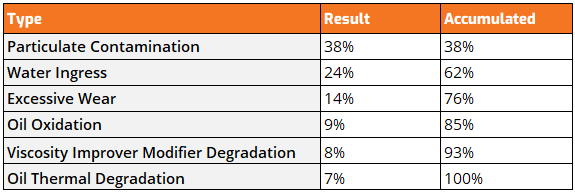
Applying the Pareto rule, the three main factors that affect the availability of the plant’s hydraulic systems are particulate contamination, water ingress, and excessive wear.
If this analysis were to stop here, and this is what happens in 90% of cases due to a lack of application of knowledge of the fundamentals of lubrication, the first thing that would be done would be to work on improving the filtration, handling, and storage methods of the plant, which is not bad and would have an immediate impact on the degree of cleanliness of the oils.
At the same time, water ingress, in this case and in many systems, is due to inadequate vent points and seals, which leads to water ingress into the system and consequently to the lubricant.
Let’s take a closer look at particulate contamination for a moment. Let’s look at this from several perspectives:
- Lubricant oxidation
- VI improver additive loss
- Thermal degradation
In all three cases, the result is an increase in the concentration of soft solid particles present in the oil.
And yes, the answer, dear reader, is in that word that has gone unnoticed before your eyes, soft, which is not hard, is not abrasive. The method used for particle counting must be appropriate, eliminating organic compounds and water. Once this first problem has been overcome and the count verified, it is necessary to determine what type of particles are present in the oil.
Thus, having corrected the particle counting method, changed oil analysis providers, and analyzed a set of samples under a microscope, it is evident that solid but soft particles are present in higher concentrations than abrasive ones. These soft particles do not have an abrasive effect on components and do not cause wear. They do reduce heat transfer, increase oil temperature, and induce premature oxidation.
Actions Taken:
- The 4 types of hydraulic oils used in the plant are replaced by others with better IV characteristics and a slightly higher working temperature range.
- Added breathers to some units
- Trained technicians in clean oil handling
Results After 6 Months and 220 Samples
The results in just six months show that 69% of the samples are under perfect conditions, compared to the previous situation where almost every sample has been flagged for a reason.
The Pareto principle is a tool used to identify those situations that cause the most problems. However, its applicability must be based on the context in which it is used; in this case, a simple analysis of the fundamentals of lubrication and oil analysis.