Have you ever wondered how a launched-from-scratch vibration program can require investment ranging into the mid-six figures, pull the most talented and skilled repairmen, and disrupt other condition-based agendas? I used to wonder. The answer boils down to the most crucial message in MBA programs worldwide: Cash is king.
Companies selling vibration analysis tools don’t compete with other companies, giving the tools away as a technique to get into some other supply relationship. They have to compete to earn the business, meaning they have to demonstrate value.
In the lubrication provision world, the value of oil analysis is trodden underfoot when it is strategically given away to entice a user to commit to a new supply arrangement. This is the nature of the business and isn’t evil. This approach meets a significant market interest and price-based competition for the lubricant supply arrangement.
Wishing this dynamic wasn’t so won’t make it go away. Those trying to sell oil analysis as a tool must agree that the best way to overcome “free” services is to demonstrate superior value for “purchased” services.
I contend that this is more about knowing the customer’s needs, the tool’s capability, the lab’s capacity to understand what the data means (and report accordingly), and financial analysis techniques than having the test slate delivered by a different laboratory.
The economic value proposition for oil analysis or any other condition monitoring technique is much greater than its simple cash flow value.
Many managers cover the cost of the expense by minimizing another cost elsewhere. That is conventional thinking. The same thinking prevents companies from optimizing their preventive maintenance task lists because doing so requires some initial investment. It is penny-wise and dollar-foolish.
Managers who are seriously intent on applying modern maintenance concepts, tools, and techniques to preserve machine health are aware of the benefit that oil analysis provides in terms of its long-term view into machine health. Belief alone, though, isn’t enough.
Some numerical form of justification is expected. In the following paragraphs, I’ll address three perspectives on how one might justify implementing or markedly improving an oil analysis program, beginning with a quick tally of the costs associated with setting up a program.
The Economics of Machine Health Monitoring
The tactical process starts with sample collection, and the secret to success is location, location, location! Drain port and drop-tube samples from sumps are helpful in looking into oil health, but oil health measurement is on the low end of the value proposition scale.
The lubricant soup will be largely homogenous from one side of the sump to the other. Contamination and wear debris, however, are not. To achieve consistency, sample collection requires a few key constraints, including:
Properly Staged Sample Collection Port
A sample collection port is a device permanently mounted into the machine and enables fluid to be extracted from the same ideal (one hopes) location each time a sample is drawn. This is particularly important for effective wear debris and contamination measurement since these two parts of oil analysis can deliver highly misleading differences in readings depending on where the sample is pulled.
Depending on materials and construction, sample ports range from $20 to $300. Assume an average of $150 for a one-time charge installed. To account for the long-term cost of maintaining the ports, expect to replace them every 1-3 years. This would be an aggressive replacement schedule. Nonetheless, bad things happen, so you should plan for the future.
Properly Devised Sample Procedures
Repeatability begins with the sample port. If installed in the correct location, repeatability is achieved easily enough. The next chore is to document the method, task an individual to collect samples and place the routine in the maintenance-scheduling program.
Sample collection documentation costs should run less than $100 per machine to hire a consultant to put it together. Much less if it is written internally.
Properly Selected Test Slate and Laboratory
Machine criticality, environmental conditions, the strictness of the alarm set, and the type of components under surveillance drive the test slate selection. High-criticality sumps should include ample testing to clearly define contamination and lubricant degradation conditions beyond routine particle count, FTIR, and crackle testing.
Laboratory test slates run from as little as $10 to as much as $60 for a routine sample. In this instance, cheaper doesn’t mean anything. Quality differences exist between labs to the extent that price shopping is nearly meaningless without some reasonable evaluation of the labs’ quality practices.
In-plant labor cost per sample represents around $23.63 to collect, label, package, and ship the sample (.5 hours x $35 x 1.35 = $23.63). This cost also should be factored into the net cost.
To be safe, assume a $35 median per sample lab price and $23.63 per sample collection cost. This should allow the site to maintain flexibility in selecting from a range of test methods for primary and secondary testing.
Properly Selected Test Interval
The sample interval should be determined after consideration of the same parameters, as noted for the test slate and lab selection. High-criticality machines operating in highly stressful environments with narrow alarm limits should be screened on very short (roughly weekly) intervals and lab-tested following any finding. This will drive the frequency toward monthly to quarterly for most machines. Low-critically machines may warrant analysis to determine oil change requirements, if nothing else.
Assume a quarterly routine at the minimum for critical sumps and an annual routine for non-critical sumps. In simple terms, with a combination of critical and non-critical machines requiring 400 samples per year over three years, we have something like this, as shown in the chart below:
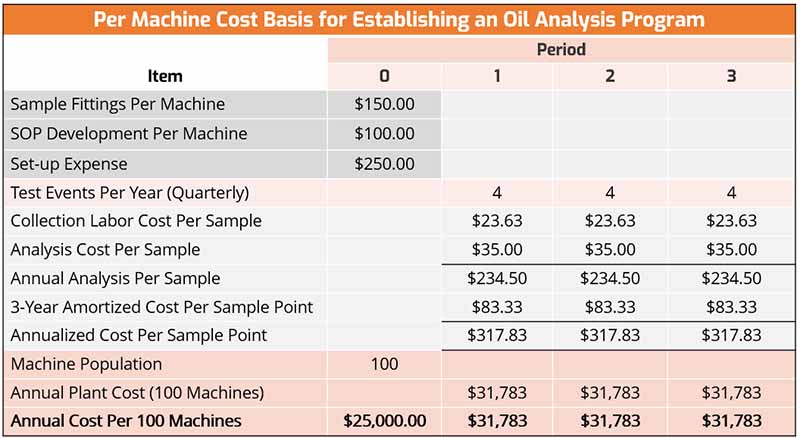
Every company has slight differences. One must be sure to account for all of the discrete charges.
Following a typical criticality distribution where a quarter of a site’s machines are rated critical, a company with 100 critical machines would have a net population approaching 400 machines. Even though it wouldn’t be considered a large site, this is a slight increase in expense, rounding up to $2,650 per month.
Justifying The Plan
There are a couple of approaches to justify this effort. Short of having a database full of mechanical component replacement costs (which would simplify matters), here are four solid options.
Option 1 – Cash flow increase. In this view, the increase in expenses is covered by a decrease in other costs. Back to the sample size, assuming the 100 critical machines average 25 gallons of oil per machine and the fully burdened cost of the oil/lubricant is $24 per gallon, the price per sump change is $600 ($8 per gallon times 3.0 for the cost associated with purchasing, shipping, storage, planning, work-order generation, lubricant swap-out labor, waste oil handling, and disposal expense). The analysis cost is covered if one could avoid changing out just five machines per quarter or 20 machines per year.
Option 2 – Repair avoidance. If plant management is thinking critically and honestly, it would have to admit that the prospect of avoiding a mechanical repair each month is worth $2,650 in direct costs. One major save per 100 machines per year would cover the cost of program implementation. This seemingly is self-evident, but one must still evaluate based on facts.
There are many case studies on this topic in electronic and paper formats. In each instance, the scale of cost reductions enormously outweighed the cost of sampling and analysis. Anytime production losses are included, the cost-savings ratio is lopsided. Here are a few examples of overwhelming savings from standard production processes.
CASE STUDY 1
Company: DaimlerChrysler Stamping Plant, Warren, Mich.1
Problem 1: Sheared stud for a 1,000-ton Hamilton Press.
Problem 2: Cracked rocker arm for another 1,000-ton Hamilton Press.
Impact: Repairs cycle reduced to three weeks and 24 hours, respectively, vs. several months.
Oil analysis benefit: Wear debris analysis.
Accrued savings from avoidance: more than $1 million in repairs and production losses.
CASE STUDY 2
Company: Rompetrol Petromidia (refinery), Romania.2
Problem: Hydrogen compressor failure due to degasification performance loss.
Impact: Partial production losses during repair.
Accrued savings from avoidance in Euros: 2.94 million from unit production losses.
Oil analysis benefit: Gas contamination analysis.
Accrued savings from avoidance in Euros: 105,600 from repair avoidance.
Company: Mobil Oil (improvement case study).
Problem: Hydraulic mining shovel—premature hydraulic pump failures.
Maintenance cycle: Four failures in the first 27 months of operation.
Impact: $24,000 in repairs, $30,000 in production losses for each event.
Oil analysis benefit: Contamination and degradation monitoring and control.
Accrued savings from avoidance: $99,000 per year annual savings.
Option 3 – Productive capacity improvement. Reducing maintenance costs or avoiding a maintenance debacle isn’t the best reason to adopt an oil analysis or any other condition assessment program. Reducing the unit cost of production by increasing productive capacity means much more to plant profitability than incremental cost control.
A company’s cost of goods sold equals the total cost divided by units produced. Many things, some of which are uncontrollable, impact the numerator. Raw materials and energy are the primary components of material cost, and both are beyond the purchasing department’s control.
Given the escalating nature of both cost categories, increasing production is the best chance to move from the high-cost producer to the middle- or low-cost category.
Efforts such as condition monitoring and control programs, which increase productive capacity without new capital investment, are highly desirable.
For example, the Rio Tinto Boron operations operate Terex haul trucks. During two months, the operation experienced unexpected failures on four Detroit Diesel 16V4000 engines. The rebuild cost is high for these large (2,000 +/- bhp) engines. The equipment owner evaluated the circumstances to avoid future failures.
Still, during discussions over tactics to prevent catastrophic failure, the team became convinced there was enough information in the oil and filter element analysis data to enable a rebuild cycle extension from 750,000 gallons of fuel (the OEM’s projected rebuild point) to 1 million gallons.
Given that these four engines were consuming fuel at an average rate of 36 gallons per hour, the extension would allow for an additional 6,950 hours (for each engine) of increased productive capacity from the initial capital expense.
Healthy skepticism was replaced with confidence as decisions were made to overhaul based on data, machine components were examined, and wear rates were confirmed. The group accomplished its expectations, but more importantly, the group expanded capacity without new (meaningful) capital expense.
These case studies affirm the point that oil analysis value can be demonstrated in several ways, including:
- Reduced machine capital-cost requirement per unit of work accomplished.
- Reduced average annual repair cost (through increased years of operation).
- Increased productive capacity for capital investment.
- Improved return on capital from value-enhancing company activity.
- Reduced direct expenses.
Option 4 – Financial analysis and modeling. An amalgam of the previous three concepts, this option is last in the discussion for a couple of reasons. Financial modeling is expected to be wholly objective; it presents the most potent argument to either adopt or reject the implementation of the technology, and it is difficult to do well because hard data is required.
Plenty of data can be found, but actual component lifecycle and cost data are sometimes difficult to locate. If not available in the computerized maintenance program, the next best place to look is the purchase record (file cabinet or computer record). Component replacement numbers, intervals between replacement, cost, and type are all relevant to the discussion.
Once the program implementation cost and improvement targets are determined, the commonly used financial models for value calculation work well enough. Return on Investment, Internal Rate of Return, and Net Present Value are valid.
In simple terms, each provides the projected savings less the projected cost and then discounts the long-term value of savings according to the cost of money during the evaluation period. Each gives an indication of whether it makes sense to proceed or not.
WearCheck South Africa presents one effective value calculation model. In his article, John Evans spells out how one can estimate an investment’s long-term value, arrives at a conservative 7.6:1 ratio for value received from an investment, and projects further that 10:1 is achievable.
Engineers at Ontario Power Generation published another value calculation model that shows a $136,000 avoidance savings. In this instance, the standing analysis program detected a problem on a small but critical pump. Detection and early action enabled management to avoid catastrophe and make repairs at substantially lower costs than would likely have been incurred if the program didn’t exist.
In the review, the weighted cost of a likely failure is estimated and presented as the savings accrued by avoiding a failure through testing. The analysis was extended to all similar pumps, which hadn’t been in the sample routine because of the small sump size. The authors did a thorough job of incorporating likely production cost risk into their estimates.
Value from an oil analysis program can be demonstrated in several ways, including (1.) cash flow improvement, (2.) failure avoidance, (3.) productive capacity improvement, and (4.) detailed assessment and financial modeling (which may include details from each of these three options).
The first step is to establish what is to be measured and estimate the cost to initiate the program. Some faith is warranted in oil-based condition monitoring techniques based on their historical strength. In simple terms, savings between 7 and 10 to 1 is achievable. The savings and production improvement value can be incredible if careful analysis is conducted.