Years ago, I had my first encounter with one of the predictive maintenance technologies. Since then, I have seen its potential, especially when combined with other PdM tools.
Airborne ultrasound for bearing inspection is probably one of the simplest, most versatile tools, and the results can be seen almost immediately.
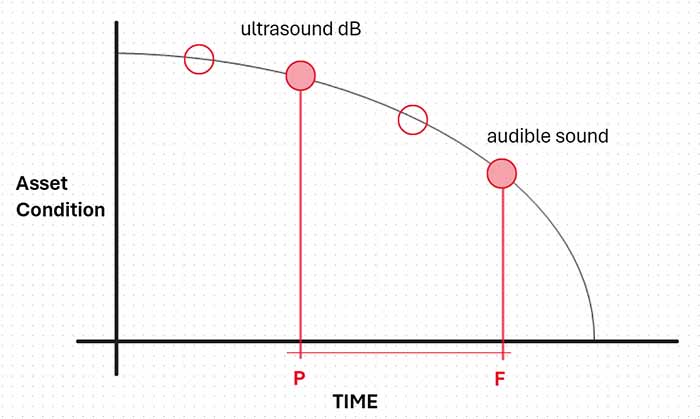
Depending on the source and author, ultrasound is usually at the beginning of the P-F curve ahead of other tools. While this is debatable, and there will be cases where it is and others where it is not, we agree that we cannot deny its value and the benefit it has in determining the condition of the bearing.
In the worst-case scenario, if no remedy is applied, the inaudible ultrasound will tend to be audible, and the bearing will be very close to functional failure.
In a very simplistic way, the theory governing this tool says that ultrasound (dB) results from friction between the rolling element, the inner race, the cage, the lubricant, and other elements, such as external contamination and internally generated wear.
To keep the ultrasound in a normal range, the lubricant and grease for the present study’s analysis are added to minimize friction between the bearing components. In this way, contact and wear are reduced, and the service life of the bearing is extended to achieve the expected life.
Around this concept and with the booming entry of Industry 4.0 into the PdM sector, sensors have been designed that automatically add grease, a precise volume so as not to overload the tiny space that exists in the bearing with grease, and whenever they are detected abnormal ultrasound values.
Up to this point, everything is going smoothly and in such a way that the lubrication of bearings is a before and after this technology.
But what happens to the grease that is in service? If we were to interrogate said grease, what would it tell us? What value would it bring us?
What Can Grease Tell Us?
The first grease analysis report in service in an electric motor bearing I had in my hands dated back to 1994. Year of the Soccer World Cup, while I was watching the opening match that pitted the almighty German team against 11 Bolivian warriors, someone under the midsummer sun was taking a grease sample from a bearing that had failed, with the intention of knowing if that sample could provide any clue about the failure.
At that time, oil analysis had already been providing benefits for some decades, but grease… who would think of analyzing grease?
Now we know how much grease analysis can contribute to maintenance and reliability; at least some of us are clear about it, and we know how to get the most out of it.
A grease sample obtained properly shows the condition of the bearing; it can reveal if there is contamination, what type, how much contamination, if there is current passage, if there was a mixture of greases, if that mixture is incompatible and a long etcetera, that is too much to ask, at least from a non-Newtonian fluid.
Grease analysis is so vital that in the wind generation industry, for example, an appropriate analysis can warn of a functional failure of the main bearing, thus avoiding incurring a high preventable maintenance cost.
What Do Ultrasound and Grease Analysis Contribute Together?
As we have seen, both tools are incredible in isolation and provide many benefits if used properly.
But could they be used together?
I had been asking myself this question for years. I had been able to analyze about 30 bearings, obtaining grease samples and ultrasound, but specifically, without achieving adequate traceability, at least two points are needed to draw a straight line, and with only one point, I had no more than assumptions and no coherent results.
In a petrochemical plant, I quenched that thirst for knowledge. For two years, I collected grease and ultrasound samples in a group of around 60 assets of different characteristics and conditions.
The results and conclusions presented in this article cannot be generalized since they depend significantly on factors such as the type of bearing, speed, operating conditions, operating environment, types of grease used in the plant, and the human factor. Regarding the variability of manual regreasing, we cannot use a sensor in 100% of the assets, at least for now.
Although the measurement obtained by ultrasound is unique and is expressed in dB, the result of the grease analysis is divided into the following variables
- Wear ≤ 7 microns
- Wear ≥ 5 microns
- Cage wear (taking into account that there were no polyamide cages)
- Grease consistency
- Incompatibility between thickeners
- Different oil viscosities
Of these six variables, the results shown in this short article focus only on the first two, bearing wear. On the other hand, only results for the coupling side bearing are shown.
After two years, around 500 samples of each technology were obtained using a color system. In isolation, the results are as follows:
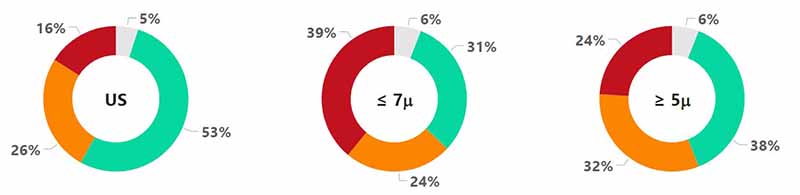
Figure 1: Bearing condition depending on technology
Broadly speaking, most bearings behave similarly depending on wear and decibel level, and an analysis of this type can yield quite a few conclusions.
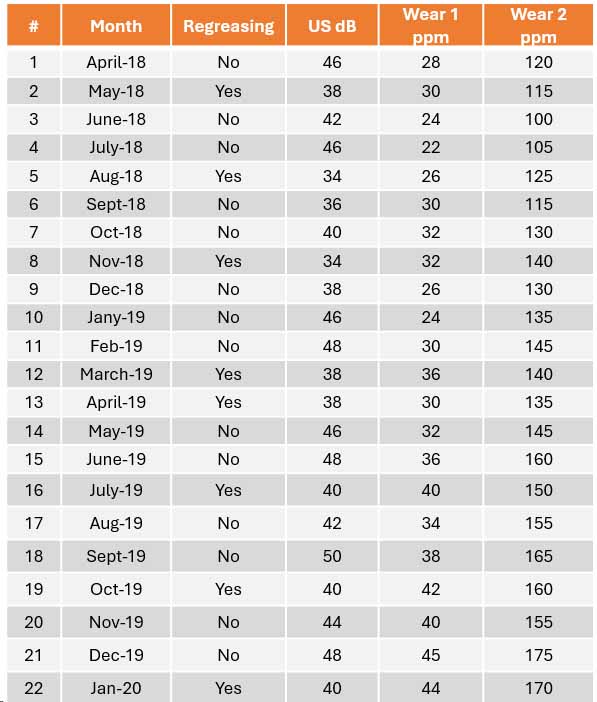
We will take as an example the coupling side bearing corresponding to the JBX – 102A unit.
This bearing had to be replaced the month after the last analysis because the friction produced internally could be heard, and subsequent analysis showed irreparable damage to the internal race.
- Greasing is done within the concept of preventive maintenance based on frequency
- Bearings are changed for corrective maintenance; they operate until failure
- The regreasing frequency is bimonthly, marked with a box in Figure 2
- In the months when regreasing is not required, only information is collected
- The volume of grease added does not exceed the calculated volume
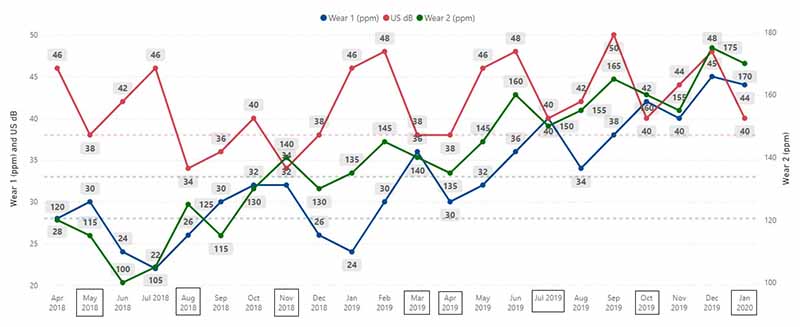
Figure. 2: Ultrasound results and wear
Initial results
Following the timeline, we can see some remarkable results.
- The ultrasound baseline for this bearing is 38dB, and the technology alerts that this limit has been exceeded after the third month (Jun-18).! Point for ultrasound! The grease analysis does not show any abnormal wear.
- Moving forward in time and after the usual regreasing, the ultrasound returns to normal values, and when everything seems to be okay, the wear measured by particles less than 7m exceeds the established limit (Sep-18).! Point for grease analysis! Ultrasound analysis is within normal values.
- After the Nov-18 regreasing, the ultrasound is within normal levels, but both types of wear have exceeded their permissible limits.
- From this point, we enter a zone of no return with increasing trends for the three variables. Due to human error, the regreasing of Feb-19 was not carried out, and to balance accounts with the management system maintenance, it was regreased two months in a row, Mar-19 and Apr-19.
- Past this point, the dB does not dramatically increase as wear does until it ends in functional failure of the bearing.
Conclusions: They May Help
Going back to the P-F curve, who anticipates the functional failure of the bearing in this case? It’s hard to say who, but the truth is that we can learn interesting things from this situation:
- Ultrasound, at least in this situation, is an excellent indicator of the qualitative outcome of the bearing condition. Yes, it gives us a value in dB, and this result is quantifiable, but it does not tell us what the wear is like.
- Grease analysis, at least in this situation, is an excellent indicator of the quantitative outcome of the bearing condition. Yes, it tells us how much it wears, but it does not tell us the friction between the bearing elements.
- Bearing component wear is a result of friction, and this, in turn, generates more wear.
- The added value of working with both technologies lies precisely in determining the friction and wear.
- Unfortunately, grease does not flow easily and tends to retain wear particles generated by friction.
- Many bearing configurations do not have a purge point to adequately remove grease and particles included, so wear, in many cases, is part of the system.
- Going from preventive maintenance, where greasing is based on frequency, to predictive maintenance, where greasing is based on condition, requires an almost perfect monitoring system. Friction—wear knows no limits.
- Limits must be respected. Whether it is 80 km/h, 38dB, or 50ppm, iron has been set for some reason.
- Corrective maintenance actions must be appropriate to the results obtained. You may not have to replace the bearing at 44dB/40ppm Fe, but it will be necessary to define what should be done; otherwise, the functional failure will decide for you.