One of the goals of Root Cause Analysis (RCA) is to identify the factors leading to an event that resulted in an undesired outcome and to develop corrective actions to prevent such results from recurring.
In maintenance, recognizing patterns during analysis can provide insights into severe outcomes, such as increased wear, which can be detected through ICP elemental analysis, elevated ferrous values by Particle Quantifier, or Ferrous Density.
It is crucial to differentiate the appropriate measures when conducting RCA. This can shift the analysis method entirely from immediately shutting down the equipment, using additional conditional monitoring technologies, or allowing other processes to assist in determining the root cause.
Technologies and Impact on the RCA Process
- Vibration Analysis can confirm a defect in the rolling element but, in some instances, only confirms the wear seen in your fluid report and can lead to a diagnosis to disassemble and replace
- Ultrasonic Analysis is more suitable for mobile equipment and offers higher advantages for slow-rotating equipment
- Thermography can indicate elevated temperatures of the running equipment
Despite these technologies providing dependable results, these tools cannot determine the amount or type of wear being presented. Fortunately, those familiar with the Analytical Ferrogram already have access to a tool to assist.
Since the fluid analysis should already be completed, the next step is to request that the Analytical Ferrogram test be performed. Tests should be requested within a reasonable time frame and recommended as soon as you get the fluid analysis results or within 30 days, depending on your fluid analysis laboratory.
This is due to how the wear metals in the fluid analysis report relate to the wear metals observed on the ferrogram. You could also submit a new sample to verify the elevated wear and request an analytical ferrogram on that sample.
A Picture is Worth a Thousand Words
Over the years, customers have used this process to determine whether disassembly is warranted. However, the average size of particles observed falls well below the visual size of what the eye can see, meaning the damage typically cannot be observed as easily once torn apart.
There needs to be more than just a visual inspection when determining wear, for example, within the United States Navy, where they implemented a Planned Maintenance System (PMS) involving scheduled intervals to disassemble equipment, inspect for wear (sometimes measuring it), and reassemble the components In many cases, the U.S. Navy observed no significant findings and repeated this process over time, eventually leading to the practice known as “gun decking” or “pencil whipping.”
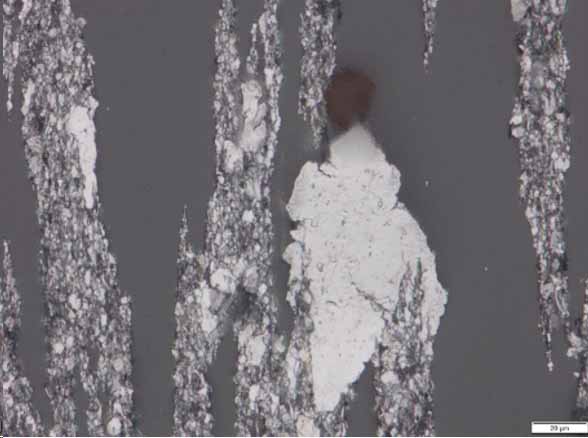
During Analytical Ferrography, the laboratory analyst reviews the ferrogram under a microscope and interprets the results. This helps apply severity to the amount and type of wear observed, and depending on the analysts’ experience, the observation can assist in providing the needed interpretation to the customer.

Analytical ferrogram showing large fatigue, cutting, and rubbing wear.
Regarding microscope analysis, training on the microscope is needed to observe the debris and truly understand how the contaminants and wear debris were generated within the system. A few critical observations considered while analyzing include:
- The purpose of the requested ferrogram
- The customers (understanding) with control
- The equipment’s environment (clean, dirty, hot, cold, etc.)
- The equipment manufacturer and model
- The lubricant type and grade
- The additives used and their purpose
Most of these items can be found in any article on the web. Sometimes, the missing element in fluid analysis is the equipment’s duty cycle, which is more in the realm of the customer’s understanding than the laboratory analysis.
Most often, fluid time and unit time are the hallmarks of determining the relation of wear occurring. However, understanding the unit’s duty cycle is essential when analyzing wear under a microscope.
Analyzing the Duty Cycle
The duty cycle is called the run time versus rest time, on-off-on cycle. Depending on the equipment, the duty cycle can occasionally have more inputs.
Information like cycle time and the material being moved or loaded must be included. For an excavator, the duty cycle is defined as pre-digging, digging, lifting, unloading, and swinging. See Figure 1.

Figure 1
Figure 1 demonstrates an example of the swing portion of the excavator and wear that commonly occurs. Rubbing wear (2 body wear) is normal as the gears will come into contact; the EP additive prevents welding when contact happens.
Next, the viscosity under load will react, slowing the contact and transmit power. However, when the slew bearing wears, it increases loading for the gear box. Excessive backlash will also increase wear and overload the lubricant’s protection ability.
This can create three-body wear, usually in the form of fatigue particles or an elevated number of laminar particles formed by flattening larger particles between surfaces.
In the example seen in Figure 2, a wheel loader duty cycle, which is the time it takes to drive forward into the mound, scoop, reverse, swing loaded dump, and repeat.

Figure 2
Figure 2 illustrates that the lubricant facilitates power transmission and offers protection against wear and loading when necessary. However, due to usage, wear can still occur if the load capacity exceeds the lubricant’s limits.
By studying the relationship between wear and lubricant protection and incorporating the duty cycle process, one can better understand the wear patterns observed in the report.
Example Guide for Analyzing Ferrogram Results
A customer submitted a sample of a crane wheel, which was lubricated and on a routine maintenance schedule, and the laboratory performed an analytical ferrogram on the sample. A ferrogram identified why wear was occurring.
The results showed the equipment was experiencing rubbing wear, fatigue wear, and laminar wear. The crane wheel was a grease bearing with NGLI 2 with a 220 cSt base oil with an average air temperature for the crane of 110 to 125 degrees F.
The amount of rubbing wear and three body wear indicated the possibility that the base oil was not providing the necessary fluid film thickness at elevated temperatures and loading capacity.
In this case, the customer was recommended to contact the manufacturer about using a higher-viscosity base oil to provide more protection.
Fluid analysis laboratories offer a wealth of helpful information for interpreting the results of an analytical ferrogram. These valuable resources enable customers to take necessary maintenance actions to address current wear conditions and prevent them in the affected unit and other units within the fleet in the future.
References:
https://www.epa.gov/moves/epa-nonregulatory-nonroad-duty-cycles


