Examining oil analysis programs – both off-site and onsite programs across various industries- it is observed frequently that oil analysis abnormal alarm observations and recommendations are not being acted upon promptly.
The ability of reliability teams to ignore the results is primarily due to a lack of trust in the triggered alarms. This behavior is known as Alarm fatigue. First identified in the medical community, Alarm fatigue is a sensory overload condition where technicians are exposed to excessive alarms, which can result in desensitization and missed alarms.
An immediate issue is the identification of the systems needing the most attention. If everything is in alarm, how do you prioritize? In facilities where workers multitask and already have significant task backlogs, ignoring or failing to respond appropriately to such warnings can lead to unplanned downtime.
This article outlines why the condition occurs and a process to intelligently set alarms using new TruVu 360 Fluid Intelligence Platform features for onsite MiniLab and FieldLab analysis.
Understanding Alarm Settings for Oil Analysis
Oil analysis alarms may be set in several ways: rules of thumb, rate of change, or OEM / Lubricant supplier guidance. However, when starting up a new program, most reliability engineers opt to focus on OEM limits. OEM guidance is focused on best practices, usually on optimum equipment design duty cycles.
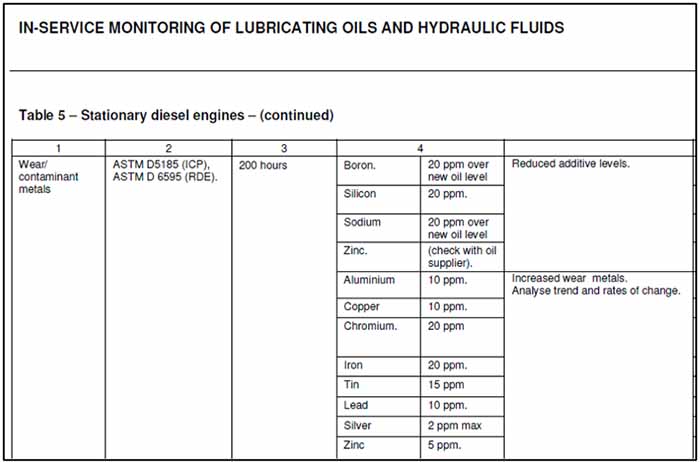
Figure 1: OEM guidance tables may resemble examples like this for Wear metals. The information is generally a guide only. However, many equipment owners rely on these values exclusively.
The challenge arises when the equipment duty cycle, lubricant type, or ability to change results from lack of repair ability (e.g., no filtration systems) leads to “normal” conditions with oil analysis measurements considered abnormal with these OEM values.
False alarms can be very problematic. False positive alarms may be triggered when severe level alarms are set too low. A conservative approach to setting alarms at the start of a condition monitoring program (e.g., OEM limits or generic industry values) can create false positive alarms that, when presented to equipment operators, lead to a lack of confidence in the capability of the oil monitoring program.
Today, oil analysis programs have more data available than ever to inform lubrication and reliability strategies. An effective lubrication program can return a 40:1 return on investment; however, this is only possible when oil analysis programs are trusted, and more specifically, the alarms and diagnostics are appropriate for the facility and machine being monitored.
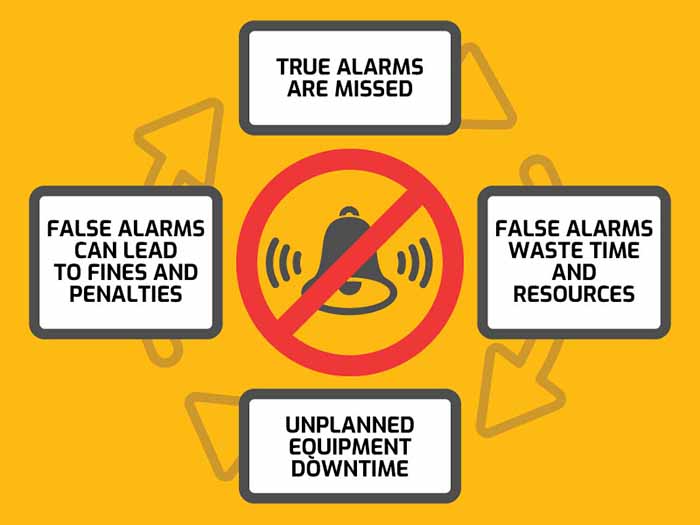
Figure 2: Alarm Fatigue leads to several problems
Keeping Control
In any organization, the pareto based principle is assumed in a controlled facility. For oil analysis programs, the case is similar, whereby a majority of equipment should be in “normal” operating mode, and a percentage (typically around 20%) is what requires attention. Usually, sample results are color-coded yellow for caution and red for severe so the owner can manage the assets that need the most attention. This has a practical benefit in any facility where assets are working and resources are limited.
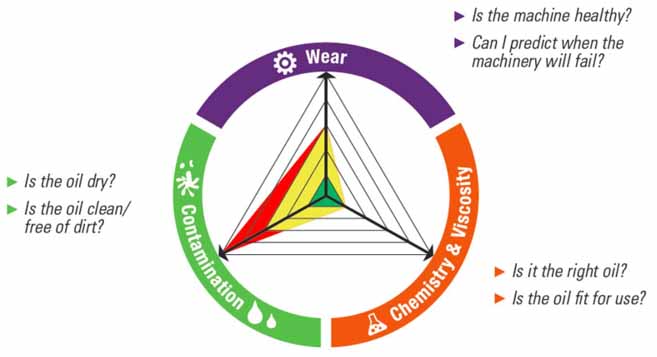
Figure 3: Visualization of alarms as a TriVector graphic. Red and yellow colors highlight caution and severe conditions in software and on oil analysis reports.
When a facility begins to have a significant amount of alarms greater than 20%, it becomes challenging to manage, and this is where alarm fatigue develops. The reliability engineer has more assets that need attention than resources available. So now what?
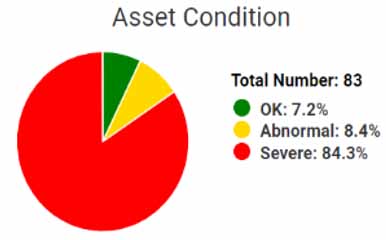
Figure 4. An oil analysis program where alarms are not set for practicality
Looking at the example in Figure 4, it is nearly impossible for a reliability engineer to manage a program when ~ 84% of the equipment is in severe alarm. If addressed at all, these alarms will likely be ignored until the next sampling.
Determining Better Alarms Using Historical Data
Determining better alarms and avoiding alarm fatigue can be achieved by performing a periodic statistical analysis, evaluating and adjusting alarms based on ASTM D7720-21 Standard Guide for Statistically Evaluating Measurand Alarm Limits when Using Oil Analysis to Monitor Equipment and Oil for Fitness and Contamination. ASTM D7720-21 defines statistical techniques for evaluating whether alarm limits are appropriate for flagging problems requiring immediate action.
The methodology and mathematics can be developed with Excel or other software; however, it involves exporting data and some effort to generate information. A new capability called Condition Based Alarms (CBA) based on ASTM D7720 is now available in TruVu 360, the fluid intelligence platform for onsite MiniLab and FieldLab systems at Ametek Spectro Scientific
The statistical evaluation using D7720 can be applied to all existing components within TruVu 360. A historical sample set of at least 80 samples within a component is required to complete the calculation. Using the guidelines outlined in the ASTM D7720, TruVu 360’s CBA feature produces an output that helps the user:
- Evaluate current alarm limits in each limit set to determine if current alarm limits are effective.
- Adjust alarm limits per limit set based on historical data (>80 samples needed).
- Evaluate the effectiveness of current alarms vs recommended alarm limits.
- Carefully and systematically develop an alarm strategy that is achievable and sustainable.
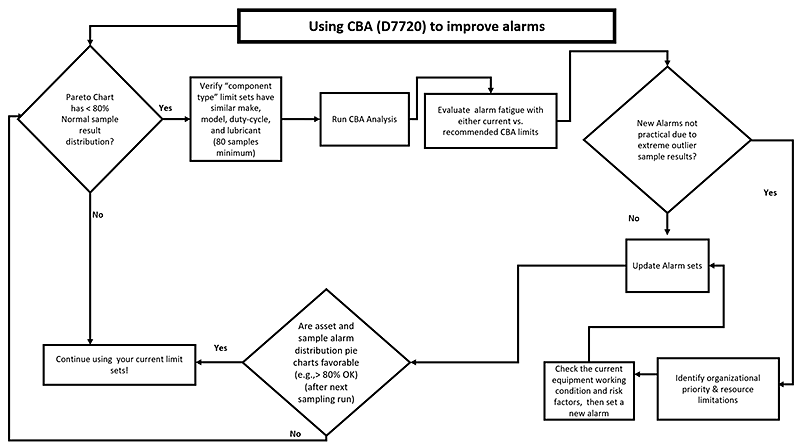
Figure 5 shows the end-users process of implementing condition-based end-user alarms into the alarm evaluation workflow.
Using Condition-Based Alarms to Manage Steam Turbines in a Refinery
Steam turbines are widely used to drive process trains in refineries. It’s not unusual to find older turbines that can tolerate high levels of water and particulate. In many cases, these same turbines are assigned alarm profiles with strict limits for particle counting and water. Routine monitoring can result in a series of false positives that maintenance personnel ignore.
A recent review of an oil analysis program at a Gulf Coast refinery showed that many of its steam turbines (93 of the 83 assets) were classified as abnormal or severe. Furthermore, the TriVector distribution indicates that 70% of the abnormal or severe alarms are a result of contamination and wear present in the oil.
Table 1 shows an example of evaluating the existing alarm set vs. the proposed new alarm set to help understand how the CBA statistical analysis of alarm limits is used within TruVu360.
 of refinery oil sample data from steam turbine.")
Table 1. Statistical analysis (per D7720) of refinery oil sample data from steam turbine.
Particle Contamination
Most reports for the steam turbines were alarmed due to the high particle count. CBA analysis confirms this and provides a new suggested alarm limit that, if implemented, will only alarm the top 3% of samples.
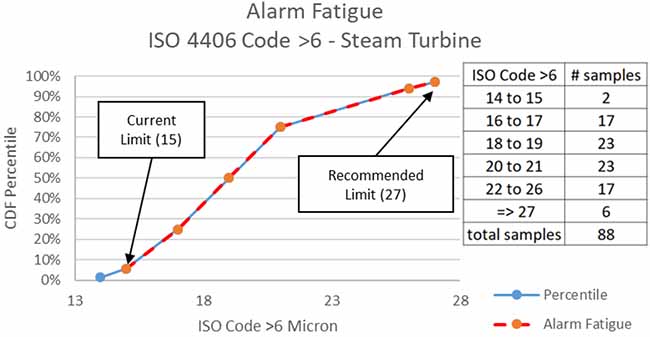
Figure 6: A visual CDF analysis of where the population of sample results reside.
The graph in Figure 6 presents CDF (Cumulative distribution function) plot of ISO 4406 Code >6 measurements. The steam turbine’s current severe limit for ISO Code >6 is 15, and the suggested recommendation based on the CBA analysis severe limit is 27.
With the CBA approach, it is easier to prioritize the effort based on the worst samples in the refinery first, which are identified by the top 3%.
It will take a consistent long-term contamination control program initiative to achieve the refinery’s current ISO 4406 Code limits. But, with step-level initiatives and [i]focusing attention on a portion of the assets to demonstrate success, The expected payback will be improved machinery health, asset life extension, overall reliability improvement, and substantial cost avoidance. [ii]
Mechanical Wear Parameters and Alarm Limits
The above example is easy to understand, as there is widespread awareness and publications of ISO codes for contamination control, and most reliability engineers can reset values based on their comfort zone.
However, many powerful wear debris analysis parameters have been introduced in the last ten years for condition monitoring that do not have much OEM detail and experience. Figures 7 and 8 present a distribution of refinery steam turbine measurements using two wear parameters: Ferrous Wear Severity Index (FSWI) and Total Ferrous. Both measure severe ferrous wear.
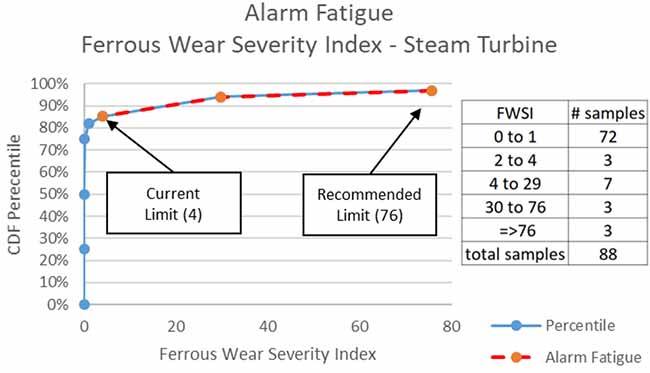
Figure 7. CDF for Ferrous Wear severity index. The current severe alarm limit is 4 (85th percentile), and the recommended alarm limit is 76 (97th percentile).
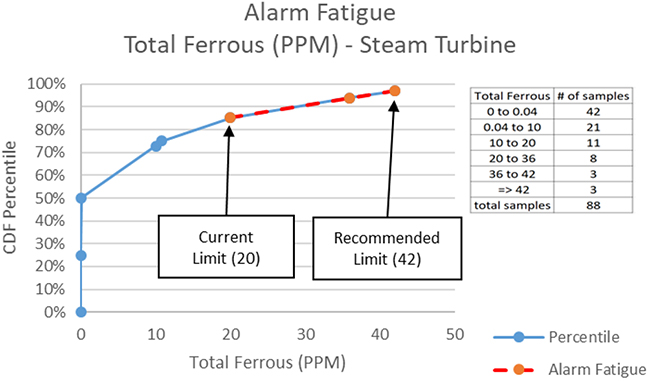
Figure 8. CDF plots Total Ferrous measurements. The current severe alarm is 20 (85th percentile), and the recommended alarm limit is 42 (97th percentile).
The steam turbine’s current severe limit for FSWI is 4, and the recommended severe limit is 76. The steam turbine’s current severe limit for total ferrous is 20, and the recommended severe limit is 42. Samples exceeding severe alarm limits for FSWI and Total Ferrous must be explained and never ignored. Consider increasing these severe wear limits from 85th to 97th percentiles to prioritize limited resources and focus on the most serious wear indications.
Alarm fatigue can prevent lubrication programs from making small improvements over time. However, the concept of condition-based alarms can help users avoid this. By carefully and systematically using data to drive alarm limits, the user can set more effective and practical alarms that can sustain maintenance efforts year after year.
For more information, please visit https://www.spectrosci.com/product/truvu-360.
References
[i] “Challenges and Solutions in Implementing a World-Class Lubrication Program,” Machinery Lubrication
[ii] Annual Cost Savings From Effective Lubrication Programs With Onsite Oil Analysis, Spectro Scientific, https://blog.spectrosci.com/annual-cost-savings-from-effective-onsite-oil-analysis