Condition monitoring tools such as vibration analysis, ultrasound, oil analysis, and thermography are mainstays of a condition-based maintenance strategy, each providing a unique perspective on the health of critical rotating and reciprocating assets. Vibration analysis and oil analysis are particularly useful for assessing oil-lubricated rotating equipment, such as pumps, gearboxes, and circulating bearing lubrication systems, as well as monitoring the cleanliness and health of hydraulic fluid.
In the world of condition monitoring, the complementary data provided by these two techniques is a case of one and one equals three! However, there is a third condition monitoring leg to the stool when evaluating hydraulic fluids and the circulating lube oil system, namely filter analysis.
Why Oil Filter Analysis Belongs in Your Condition Monitoring Program
Due to the impact that contamination has on equipment life, any circulating system requires an oil filter, typically located on the pressure (supply) side of the system. For hydraulics, filters are used on the pressure line, as well as on case drains, return lines, and occasionally on offline systems.
The role of the filter in both circulating lube oil systems and hydraulics is obvious – it is designed to trap any particle in the system larger than the micron rating of the filter. But this is also what makes filter analysis so valuable as a condition monitoring tool.
A used filter is more than trash—it’s a time capsule of your machine’s distress signals.
Unlike oil analysis or vibration analysis, which are snapshots of what’s happening within the system at the instant the oil sample is extracted, or the vibration signature is recorded, filter analysis is a historical record of everything that has happened in that system that generates larger particles since the last time the filter was changed.
Since some filters do not need to be changed more often than once a year, this provides substantial historical evidence of an incipient problem. With the “data” in the form of trapped articles accumulating over time, providing a much higher probability of detecting an incipient failure,
What Oil Filter Analysis Reveals That Other Tools Miss
In general, filter analysis is capable of identifying four types of problems:
- Large wear debris caused by active machine wear
- Particles and other debris ingressed from the outside due to poor sealing, intrusive maintenance, or ineffective breathers
- Solid and semi-solid particles created by lubricant upset, such as excessive oil degradation, accidental cross-contamination with an incompatible fluid, or a reaction between the oil and an ingressed process fluid or cleaning agent.
- Internally generated particles from hoses, seals, and other sources of non-metallic debris
Often, the nexus for filter analysis is a filter that has plugged prematurely. Whenever a filter plugs, the system will often go into bypass. Without swift action, this can result in trapped particles migrating upstream.
But instead of simply swapping out the plugged filter, hoping for a different result next time, sending the plugged filter for analysis can often identify an issue that may be hidden from oil analysis, vibration analysis, or other condition monitoring tools.
Effective filter analysis uses many of the same tests used for oil analysis. In particular, elemental analysis, which examines the presence (or absence) of specific elements such as iron, copper, or lead as wear elements, or calcium, zinc, or phosphorus, which are common additive elements, is the most commonly used method. However, elemental analysis is not he only test applicable to filter analysis.
Before running appropriate tests on the filter, labs often perform a simple visual inspection of the filter, such as examining the seals and end caps or filter pleats, to ensure the filter has not lost its structural integrity.
Once complete, several different methods may be deployed to extract information from the filter. This includes back flushing using a variety of solvents or cutting open the filter and extracting a representative cross-section for further physical or chemical analysis.
Oil Filter Analysis Techniques: From Backflushing to Microscopy
Many of the tests run on the extracted deposits seek to determine the chemical composition of any solid or semi-solid material removed from the filter. The most basic of these is atomic emission, whereby the atomic composition of the extracted material is determined, much like the elemental analysis test run on bottle oil samples.
However, while it is possible to run conventional elemental oil analysis tests such as inductively coupled plasma (ICP) or rotating disk electrode (RDE) on filter debris, oftentimes more specialized elemental testing such as x-ray fluorescence (XRF) or energy dispersive x-ray (EDX) are used, often in conjunction with scanning electron microscopy to image and identify the composition of specific particle trapped within the filter media.
Filter debris isn’t just gunk—it’s chemical evidence waiting to be decoded.
Figure 1 shows an example of how these tests work. In this case, an SEM-EDX scan has identified a particle trapped within the media as being comprised of silicon and/or iron. In this case, it is likely that the silicon is simply from the microglass filter media, while the iron might indicate the presence of wear debris, approximately 10 microns in size, with a 1:1 aspect ratio, which is often indicative of sliding wear.
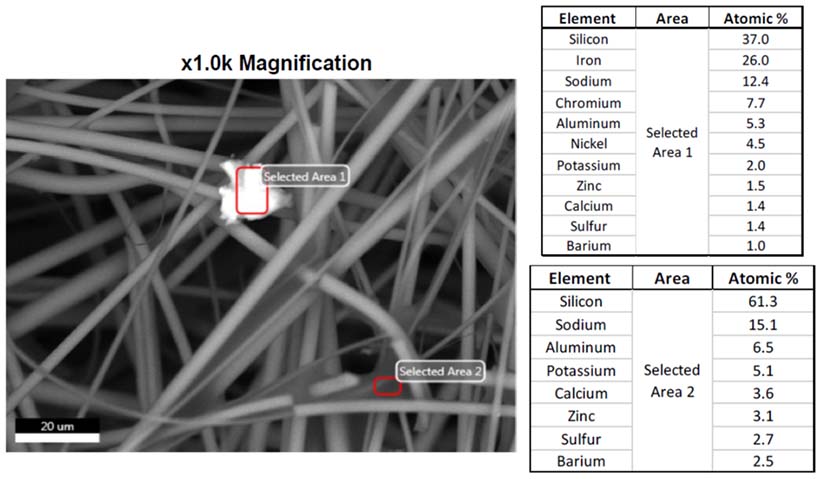
Figure 1: SEM-EDX image of a filter
While EDX or XRF is helpful for detecting metallic or inorganic materials from the filter, Fourier Transform Infrared Spectroscopy (FTIR) is often used to identify molecular “fingerprints” of organic materials, such as degraded base oils, stripped additives, or chemical contaminants. Since FTIR instruments are often equipped with a “library” of known organic compounds, unexplained inorganic residue within a filter can often be identified through spectral comparison.
Figure 2 shows an example of an FTIR spectrum from a sample of material from a filter that has been extracted using a pentane flush. Since lubricants, hydraulic fluids, and the filter are comprised of tens or even hundreds of thousands of different compounds, it is common to compare the FTIR spectrum of the extracted filter sample with a new oil baseline and the filter media.
This is achieved by subtracting the filter or new oil spectrum from the test sample spectrum to obtain what is often referred to as a “difference” spectrum. In the example shown in Figure 2, the FTIR library search has identified a 75% match for polybutylene in the difference spectrum between the filter media and extracted filter debris. Polybutylene is a commonly used viscosity index (VI) improver, suggesting that the filter is being plugged with the VI improver from the engine oil being filtered.
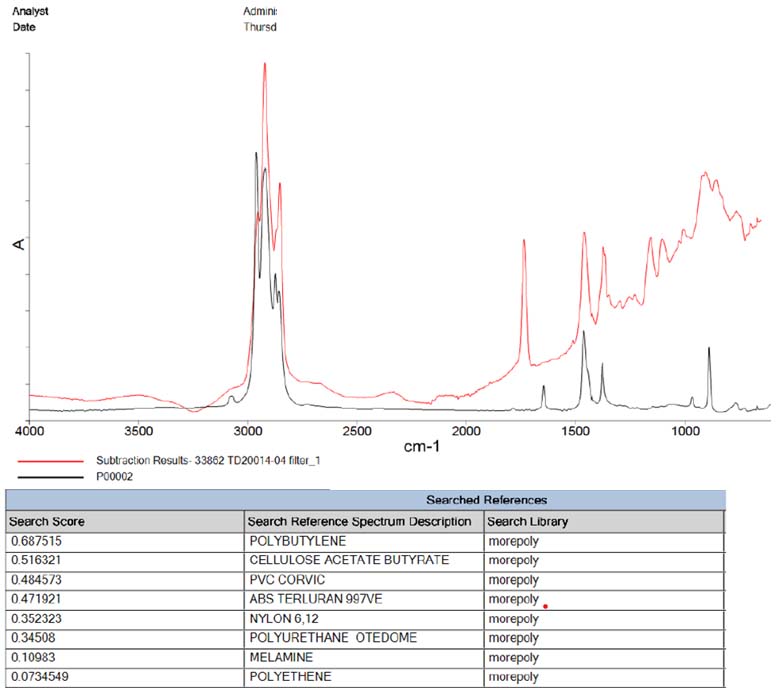
Figure 2: FTIR difference spectrum of engine filter
Oftentimes, the most valuable testing of a filter comes not from sophisticated chemical testing but from an experienced analyst observing the filter and extracted material under a high-powered microscope, capable of magnifying the image 200-1,000 times. This technique, which is also deployed on bottle oil samples, is often referred to as analytical ferrography or, more generally, microscopy.
Unlike conventional wear debris analysis, the analyst evaluates particle morphology (size, shape, color, texture, etc.) to examine large particles trapped within the filter. This can often be helpful when trying to determine the root cause of active machine wear as part of a root-cause failure analysis (RCFA). Analytical ferrography can be deployed directly to the filter media or from a sample extracted from the filter using a solvent, which is then dispersed onto a microscope slide or a lab filter patch.
What Four Real-World Failures Teach Us About Filter Insights
While the purpose and uses of filter analysis are many and varied, consider the following use-case example, which illustrates the potential benefits and analytical capabilities of evaluating filter condition and filter content.
Use Case 1 – Paper Machine Bearing Failure
A paper mill experienced a catastrophic failure of a suction roll bearing. After investigation, the oil supply lines to the bearings were found to be plugged with a grease-like material, resulting in lubricant starvation. A similar deposit was found in the main supply line filter, which had plugged and gone into bypass. The plugged filter was removed and sent to a laboratory for analysis, along with in-service oil samples.
The oil sample missed it—but the filter held the chemical smoking gun.
While the oil sample showed no indication of the root cause of the problem, the semi-solid residue from the filter was analyzed using FTIR, which revealed a match with a stearate soap material, as well as traces of sulfur, zinc, and phosphorus from the oil’s additive package.
Upon detailed chemical analysis, the problem was diagnosed as a chemical reaction between the oil’s antiwear additives and a detergent used to clean the paper machine, which had entered the lube oil system during routine cleaning of the machine. The subsequent grease-like deposits were enough to plug the filters and starve the bearings of lubricating oil.
Use Case 2 – Lube Oil System Filter Plugging
A chemical plant was experiencing foaming issues in a circulating lube oil system. Due to a high rate of filter change-outs, it was suspected that contamination was causing both the filter plugging and the foaming. To control foaming, an aftermarket foam inhibitor was used; however, the problem persisted, and foaming continued to worsen.
Samples of the in-service oil, both before and after adding defoamant, along with a portion of the filter and a sample of the antifoam additive, were submitted to the lab.
Elemental analysis of the material extracted from the filter using rotating disk electrode (RDE) atomic emission spectroscopy as well as a microscopic examination of the filter sample revealed high levels of silicon in the filter, as well as a visible amorphous white residue within the filter media indicating that filter plugging was due to stripping of the antifoam additive (Figure 3), caused by overdosing with an aftermarket defoamant.
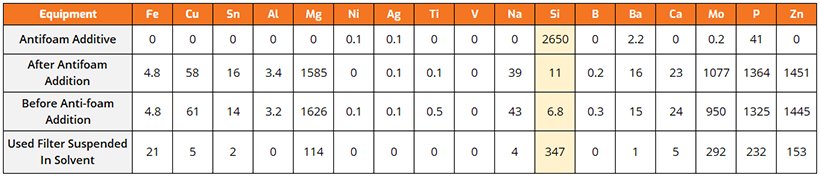
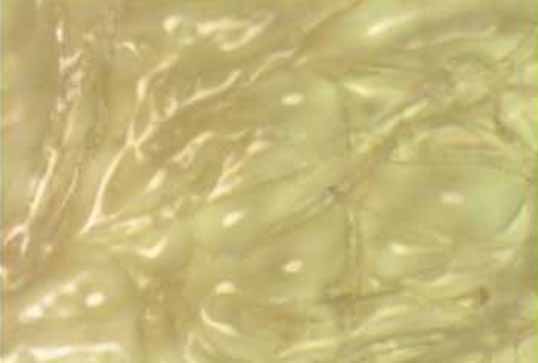
Figure 3: RDE analysis of filter residue along with 100x magnified image of filter debris
Use Case 3 – Hydraulic Filter Plugging
A food manufacturer decided to switch from a conventional mineral-based AW46 hydraulic fluid to a synthetic food-grade lubricant. At the same time, an offline filtration system was added to enhance overall system cleanliness and improve pump and valve reliability.
Despite these changes, the cleanliness of the oil, as measured by ISO particle counting, became worse, and valve failure started to occur. No evidence of any issue was seen in routine oil analysis, except for elevated particle counts.
After removing and examining the offline filter, it was found that the filter media was coated with an inorganic material. When tested using x-ray fluorescence, high levels of zinc and phosphorus were detected, as well as what appeared to be oil degradation by-products (Figure 4).
After comparing the results with a test for oil varnish potential, it was concluded that the new oil increased solvency levels to the point where the old deposit, caused by degradation of the old AW46 fluid, became re-suspended in the oil, plugging the filter through an increase in “soft” particle contamination. After a thorough flush and clean, the unit was put back into service with much improved results.
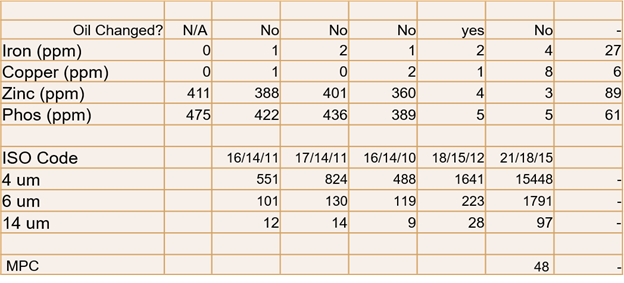
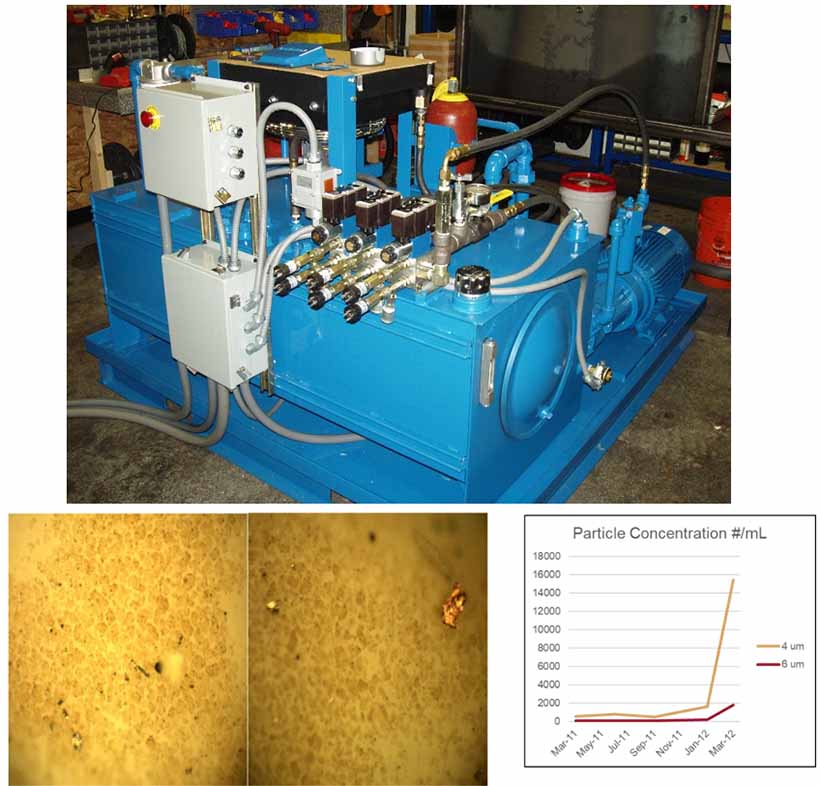
Figure 4: Filter patch test and ISO particle Count
Use Case 4 – Plugging of a Steam Turbine Lube Oil System
A paper mill was experiencing premature filter plugging on its main power generation (steam) turbine. The plugged filters were submitted to the lab, and a series of physical and chemical tests were performed. After solvent extraction from a section of the filter, material from the filter bed was analyzed under 500x magnification. Ferrographic analysis revealed a series of black, irregularly shaped foreign particles dispersed throughout the sample (Figure 5).
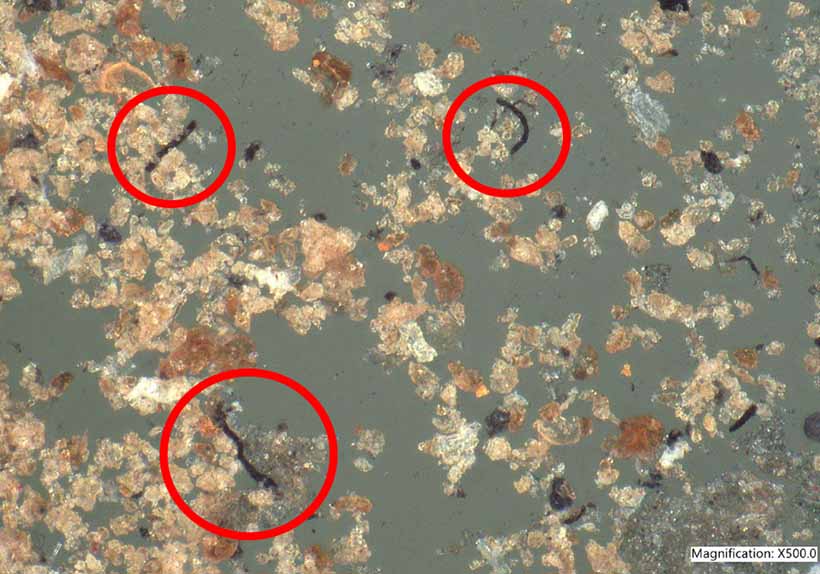
Figure 5: Ferrographic Analysis of Filter Extract
To determine the chemical composition of these inorganic fibers, Laser-induced breakdown spectroscopy (LIBS) was applied to the ferrogram. LIBS uses a high-powered laser, focused to a 5-10 micron-sized “spot” which is directed onto one of the unknown particles. Due to the high power of the laser, the suspect particle is atomized, causing the sample to emit light at unique wavelengths, corresponding to the atomic composition of the particle.
Much like elemental analysis on bottle oil samples, these unique wavelengths can be measured and quantified using an emission spectrometer. Based on the LIBS analysis, the composition of the black particles shown in Figure 5 was determined to be largely fluorine and silicon, indicative of a fluoropolymer (VitonTM) seal material.
LIBS lit up what oil tests overlooked—seal debris and signs of deeper trouble.
While the presence of seal material in the filter was interesting and correlated with recent seal failures within the turbine, the lab determined that there appeared to be an insufficient concentration of seal fibers to account for total filter plugging, so they continued their investigation.
Upon microscopic analysis of a section of the filter media, the lab noticed that the filter fibers appeared to be coated in a gel-like “slimy” material, with small black dots interspersed between the fibers (Figure 6).
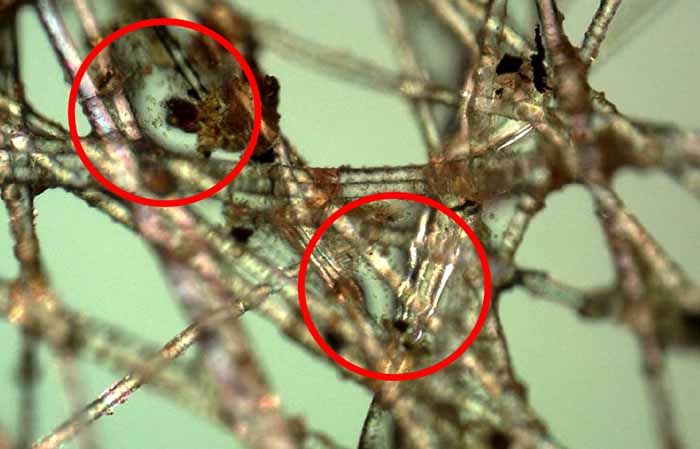
Figure 6: Microscopic image of a section of the filter media taken under 500x magnification.
The filter sample, complete with “slime,” was subject to an adenosine triphosphate (ATP) luminometry test, which is used to determine the presence of active microorganisms. The elevated results from ATP testing suggested that the “slime” in the filter was due to biofilm from microbial growth, a common contaminant found in fuel and cutting fluids, though less common in turbine systems.
Interestingly, a video taken of a sample of the filter media under 300x magnification appeared to indicate the presence of live microbes moving throughout the media! Further analysis is currently underway to identify the source of microbial contamination and to determine the most appropriate remedial action to fix the issue.
Lube oil and hydraulic filters are often considered consumable items that are used, consumed, and then disposed of. However, next time you think about throwing out a filter, consider the trove of useful data it may contain and consider how analyzing the filter can serve as an invaluable tool alongside more conventional condition monitoring techniques.
Acknowledgment: The author would like to thank Rich Wurzbach, Dylan Kletzing, and Julie Solis of MRG Labs for their interesting discussions and for providing some of the data, images, and video presented here. MRG is a leader in innovative sampling and fluid analysis, including lubricating oils, hydraulic fluids, grease, and filter analysis.