It is very likely that you have encountered the RPVOT (Rotating Pressure Vessel Oxidation Test), a laboratory test developed in the 1960s and later standardized by ASTM D2272. It measures the antioxidant stability of lubricating oils by accelerating oxidation in a rotary pressure vessel.
The most common result is an integer expressed in minutes that measures the time until the pressure drops by 25 psi from the initial maximum (T0 to T1) under conditions of 150°C, oxygen at ~90 psi, and a copper catalyst. Some labs include the graphic that most closely resembles one of the most famous drawings in Antoine de Saint-Exupéry’s book, An Elephant Inside a Boa Constrictor.
Although this laboratory test has a lot to say about the state and condition of the oil, it has been assumed that the result depends only on the numerical value, being that it is much more than a simple number, and knowing this test in slightly more detail can be very useful when planning the lubricant. In this article, we will analyze the oil’s behavior during this test from an energy perspective. We will examine the relationship with other laboratory tests and, finally, the application of new methodologies to assess the test’s performance.
Let’s look at three samples of the same type of oil, a zinc-free mineral oil designed for gas and steam turbines with antioxidant additives, rust and corrosion inhibitors, and anti-foaming agents. According to the technical sheet, the RPVOT test of the new oil reports 1000 minutes.
Remember that the objective of the test is to force the oxidation of the oil.
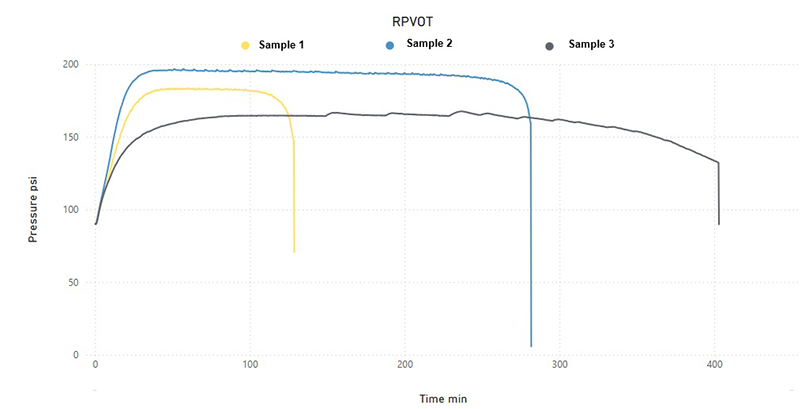
Figure 1: Case Study Samples
RPVOT Regions
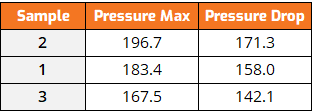
Table 1: RPVOT Pressure
PART 1: Graph Analysis
Oxidation Induction Region, Gas Heating and Expansion
An initial period where antioxidants (phenolics, amines, phosphorus) neutralize free radicals (ROO-, O2-) formed by temperature (150°C) and Cu, H2O, and O2 catalysts. In this phase, the gas’s thermal expansion predominates, water evaporates, but oxidation is still low.
- Graphically: Low slope (<0.05 psi/min), stable pressure ~192 psi.
- Entropy: minimum ΔS (+10-19 J/mol· K); under molecular disorder.
- Gases: Very few volatiles (residual H2O).
- Duration: ~35-100 min; longer in sample 2 (additives in good condition).
Region of Propagation of Quasi-Stationary Oxidation
The primary antioxidants are exhausted; the oxidative chain begins when free radicals attack the hydrocarbons of the base oil, initiating a sequence of peroxide formation, aldehyde formation, and acid formation, leading to varnish (degradation byproducts). In this phase, O2 is rapidly consumed.
- Graphically: Tipping point, average slope (-0.05 to -0.2 psi/min), drop ~192→175 psi.
- Entropy: High ΔS (+25-32 J/mol· K); Disorder increases due to the increase in molecular fragments of the hydrocarbon chain.
- Gases: CO, CO2, volatile hydrocarbons cause ~10-20 psi drop.
- Sample 3 has a steeper curve due to the consumption or condition of additives.
Region of Termination or Pressure Drop
The secondary inhibitors present in this oil, such as phosphates, recombine the remaining radicals, and in this phase, the oxidation slows, but the presence of residues is evident, which can increase viscosity and AN.
- Graphically: Low slope (<-0.2 psi/min), stabilization ~170 psi.
- Entropy: moderate ΔS (+16-22 J/mol· K); residual disorder.
- Gases: Minimal, but there is evidence of varnish or accumulated sediment.
- Sample 2 is more stable; this is evidenced by a flat curve.
Analysis by Sample
Sample 2 (more stable, total ΔP ~22 psi in ~300 min): Low degradation, additives are efficient and limit clutter.
- Induction Region (t≈48-100 min, 192.1→190.5 psi): ΔS = +10.2 J/mol· K and phenolic antioxidants intact.
- Propagation Region (100-220 min, 190.5→182 psi): ΔS = +24.8 J/mol·K. With a moderate concentration of peroxide.
- Termination Region (>220 min, 182→170 psi): ΔS = +16.5 J/mol·K. Total: +51.5 J/mol·K.
Sample 1 (mean degradation, ΔP ~23 psi): a higher initial additive consumption.
- Induction Region (46-90 min, 192→183 psi): ΔS = +14.7 J/mol·K.
- Propagation Region (90-230 min, 183→173 psi): ΔS = +27.1 J/mol·K.
- Termination Region (>230 min, 173→169 psi): ΔS = +19.2 J/mol·K. Total: +61.0 J/mol·K.
Sample 3 (the most degraded, ΔP ~25 psi): High early oxidation.
- Induction Region (35-80 min, 192→167 psi): ΔS = +18.9 J/mol·K. The exhausted phosphate additive is exhausted.
- Propagation Region (80-260 min, 167→160 psi): ΔS = +32.4 J/mol·K. Increase in volatile compounds and acid production.
- Termination Region (>260 min, 160→155 psi): ΔS = +22.1 J/mol·K. Total: +73.4 J/mol·K.
PART 2: Relationship with Other Laboratory Tests
The relationship between RPVOT and other laboratory tests is very weak and unreliable, and it is unlikely to predict a low RPVOT result.
Following our case study, we have:
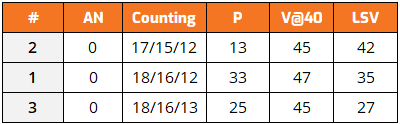
Table 2: Laboratory results
On the other hand, the repeatability and reproducibility of the RPVOT is low and this greatly reduces its reliability when making a decision in case of results that do not meet the expectations of the end user.
So, what laboratory analysis can be a good ally when performing the RPVOT? As Table 2 shows, traditional tests do not correlate with RPVOT results. However, there are two analyses that do show potential problems and can be used to work in conjunction with this test; Differential pulse voltammetry (DPV) is a powerful electroanalytical technique designed to measure the concentration of redox-active species with high sensitivity and resolution, often allowing the detection of analytes at concentrations as low as 10-8 to 10-9 molar. The next is FTIR, which allows identifying compounds in the fluid.
PART 3: Price Matters and Goes Hand In Hand with Innovation
Depending on the country and laboratory, the cost of an RPVOT analysis is usually between 150 and 650 $US, with an estimated turnaround time for results easily exceeding 10 days, not only because of the time it takes to test but also because samples may be on hold. If it is simply to comply with the oil manufacturer’s recommendations or the turbine OEM’s warranty, the end user will pay little attention to the result or the graph in the report.
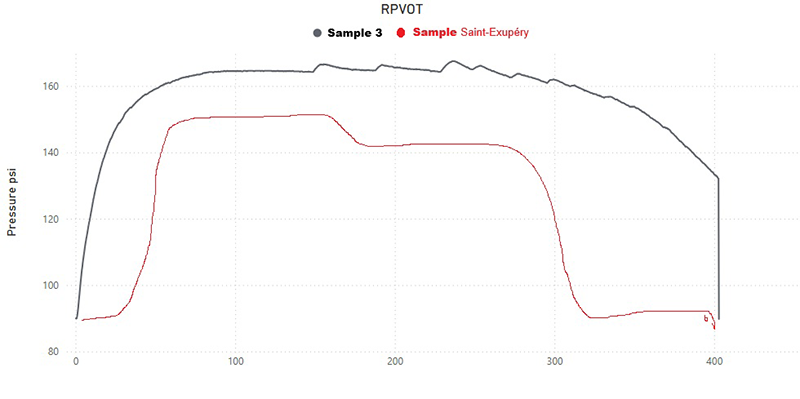
Figure 2: Comparative Analysis
The analytical tools available to us today have facilitated many aspects of our lives, including data analysis and the detection of patterns that help us identify future behaviors. Within the scope of RPVOT, in mid-2024, I was fortunate to develop an analytical tool that I called RPVOT[SYN]. Its function basically aims to minimize two key aspects of this laboratory test: time and cost.
Thus, by applying a Bayesian analysis, it is possible to determine with a degree of confidence greater than 75% what the expected result of the RPVOT of a turbine oil will be. For a fraction of the cost of the laboratory test and in less than 6 hours, you get a result very similar to this:
RPVOT[SYN] : 180 – 200
Some Recommendations: What Is Important When Receiving the RPVOT Results?
We said before that the numerical result matters, but it is not the only thing that should matter in this test. If you work with a respectable laboratory with sufficient technical knowledge, they will be able to report the graph (even in csv format) in such a way that it can be analyzed from the point of view of their regions.
Remember, the regions say much more than the simple numerical result. Cross-referencing this information with FTIR and DPV can yield much more insight into the condition of the lubricant. And it can help plan, in conjunction with other tests, a possible intervention on the lubricant, whether it’s a partial or complete change, or finding a solution due to problems related to the lubricant’s chemistry.
Don’t miss the opportunity to get the most out of an analysis of this caliber; it can tell you a lot about the condition of your lubricant.