At an industrial level, bearings are, without a doubt, the most widely used assets in all sectors and allow a lot of critical and non-critical equipment to remain in service.
Depending on the source consulted, the first wooden bearings that were discovered date back to the time of the Roman Empire, when Emperor Caligula ordered the construction of one of his whims, the floating palace on Lake Nemi.
Closer to our time, records mention Leonardo Da Vinci among the first designers of bearings, even made of wood, to be used in his machine that would later be known as the helicopter predecessor. During the Renaissance, the engineer and inventor Agostino Ramelli, in the service of King Henry III, published drawings of roller and thrust bearings.
For his part, in the 17th century, Galileo described the first bearing with a cage, understanding that at this time, they already realized that one of the problems of these components was the contact between rolling elements. By 1740, John Harrison, an English carpenter dedicated to watchmaking, put Galileo’s design into practice.
By the end of that same century, inventor and iron specialist Philip Vaughan had collected the first patent. Once immersed in the great industrial era, bearings began to expand to various sectors, and much work was done on their design and applicability.
Expected Bearing Service Life
Nowadays, there are some methods to calculate the expected life of a bearing. The most widely applied standard is ISO 281, although some manufacturers have their own variations to estimate the life of their products. In any case, and depending on the industrial sector, not all bearings reach the desired estimated life, and determining the reason was never easy.
In a survey carried out in 310 industrial plants[1], excluding the wind sector, it is evident that less than 5% manage to meet the total expected service life.
Although it may not seem logical from a reliability point of view, many industries have assumed that their bearings will not reach their full-service life and fully believe that this is due to the type of operation in which they are found and the environment and working conditions.
This article does not intend to generalize the results, nor should they be extrapolated to any industry. Still, they can be a reference, especially when the bearings do not reach the expected life.
Table 1 shows the percentage of life of various types of bearings that are regreased based on a certain frequency and critical for the plant surveyed. The study is based on a population of 1,460 bearings.
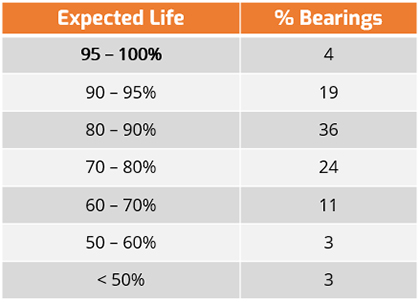
Table 1
60% of the bearings reach an expected life between 70 and 90%, and only 23% exceed 90%.
Some industries have implemented root cause analysis to determine and understand why failures occur. However, when it comes to bearings, more attention is paid to catastrophic failures and not to determine why they have not reached their expected life.
What are those reasons, and why do they occur? It is a question that many PdM tools have attempted to answer, in many cases successfully. In others, it leaves room for a question that is usually assumed to be part of the component’s operational life.
Detection of Bearing Failures
Bearing grease analysis is a handy tool if it is treated correctly and if you have precise knowledge. In many cases, it can determine the exact reason and cause of the bearing failure; in others, it can give clues as to what happened.
How do bearings fail? Logically, it depends on factors such as the type of industry and operating conditions; some sectors have a greater concentration of one kind of failure than others. Table 2 summarizes failures in 5,489 bearings identified through in-service grease analysis.
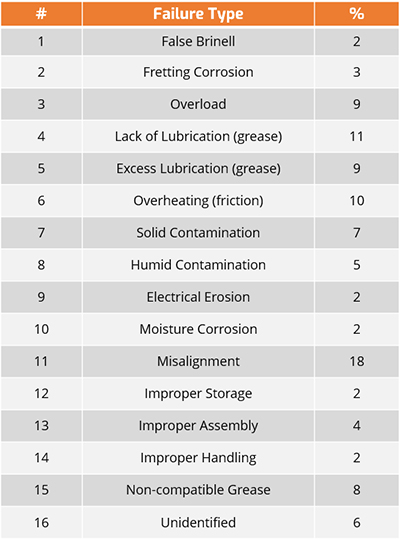
Table 2
About 30% of bearing failures are due to failures in the lubricating film. Specifically, in this failure, the lubrication film provided by the oil–grease additives is reduced or completely lost, which can sometimes cause catastrophic failure.
Both micro and macro pitting, which are types of bearing failures, are mainly due to problems in the lubricant film, which are part, in this case, of the thirty percent described above.
One of the advantages of bearing grease analysis is the monitoring that can be done from the point of view of wear.
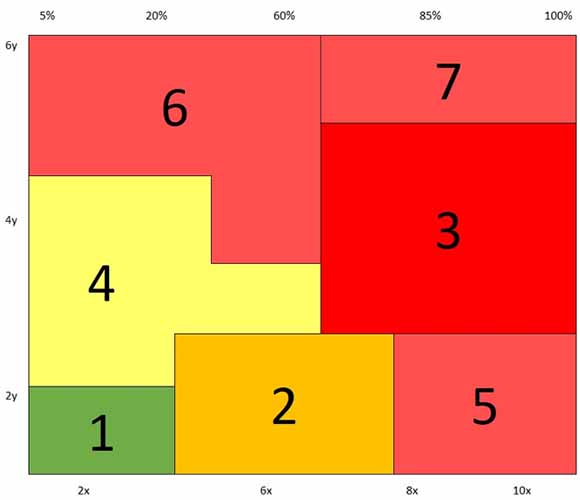
In this sense, it is possible to map normal wear and tear and when it becomes abnormal wear. The following figure shows two wear variables (X, Y) as a function of time (%).
A bearing that wears under normal conditions and exceeds 90% of its estimated life, see Table 1, follows path 1 – 2 – 3 of the wear matrix. This is what is desired and what, under normal conditions, should occur, but as we saw previously, only 23% of the bearings operate under this regime.
Monitoring and Identification of Failures
The failure types described in Table 2 can be identified in the wear matrix. For example, a lack of lubrication usually has the Y component close to the limits, which places it between zones 6 and 7. At the same time, an excess of grease shows a higher concentration of the X component.
The study allows the type of failure to be identified in many cases, and based on the analysis of historical data, it is also possible to predict the estimated service life.
Wear Matrix
Another example of the application of the wear matrix is electrical erosion. This type of failure generally shows an almost flat and very low constant in the Y variable while the X variable grows until reaching a maximum point close to 60%, which reduces the life of the bearing by up to 40%.
Different types of bearings and the type of operation, that is, operational environment and service conditions, show unique characteristics within the wear matrix. This allows for more specific monitoring of the type of wear but also of where it is going and what the expected life is.
Occasionally, this allows the problem to be identified and corrected so that it is redirected towards normal wear and expected life. This case, for example, occurs when there is an unwanted mixture of greases, point 15 of table 2; If this failure is detected in time, it can allow the bearing to reach 90% of its expected life.
The wear matrix is an ideal tool for the maintenance and reliability team. Simple to use and easy to interpret, it can answer the question raised above: why don’t all bearings reach the expected life?
References
[1] J Alarcon Grease Bearing Study GBS-219